Bhutan GIS data—a preview of UW contributions to DRUKDIF
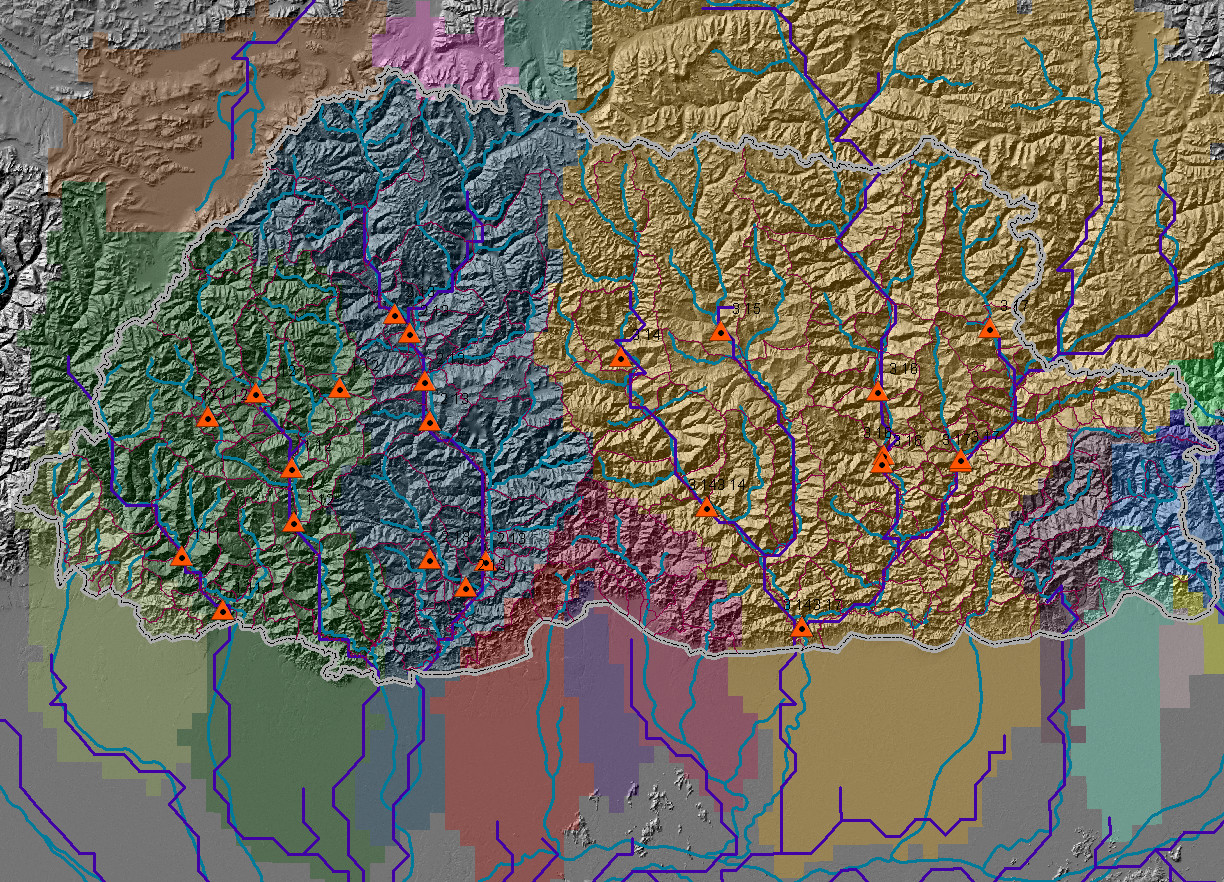 ---------------------------------------------------------------------------------------------
This shows the 27 gauging stations used with the VIC model. The updated national border is used.
---------------------------------------------------------------------------------------------
This shows the 27 gauging stations used with the VIC model. The updated national border is used.
Thse following maps were created with an old file of political boundaries.
They will be recreated with a correct map of boundaries
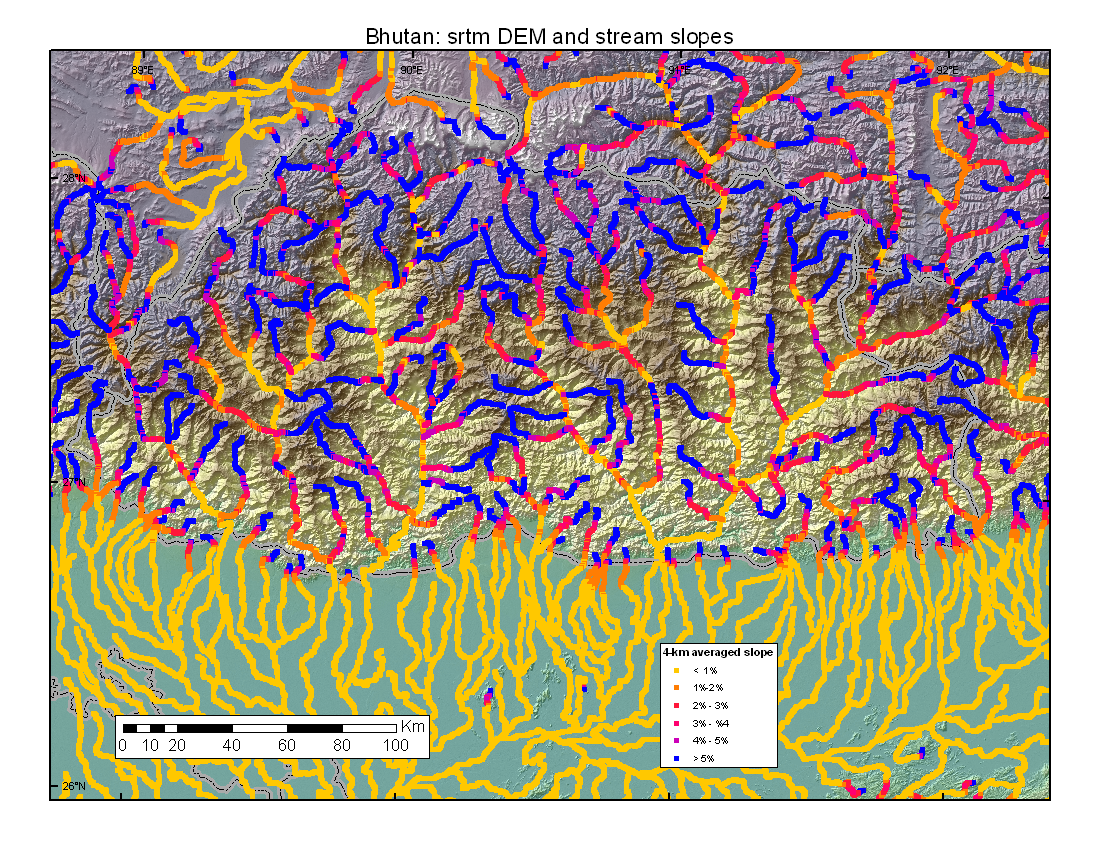
The base image is the Hydrosheds version of the SRTM DEM. Longitudinal
profiles of rivers were created by tracing from cell center to cell center.
 ---------------------------------------------------------------------------------------------
 ---------------------------------------------------------------------------------------------
 ---------------------------------------------------------------------------------------------
 ---------------------------------------------------------------------------------------------
More on stream slopes using the new
(July 2009) 1" ASTER Global DEM
We are running the VIC hydrological model at a resolution of 2.5'
(~ 4×4.6 km). The DEM was first generalized from 3" to 2.5' as follows:
- The maximum discharge for each 50×50-cell block was determined.
- The minimum and mean elevation for each block was calculated.
- Each large cell was assigned an an elevation value between the minimum
and the mean, weighted by the natural log of the discharge.
This yields a DEM that tends to respect stream channels better than a DEM
derived by other means.
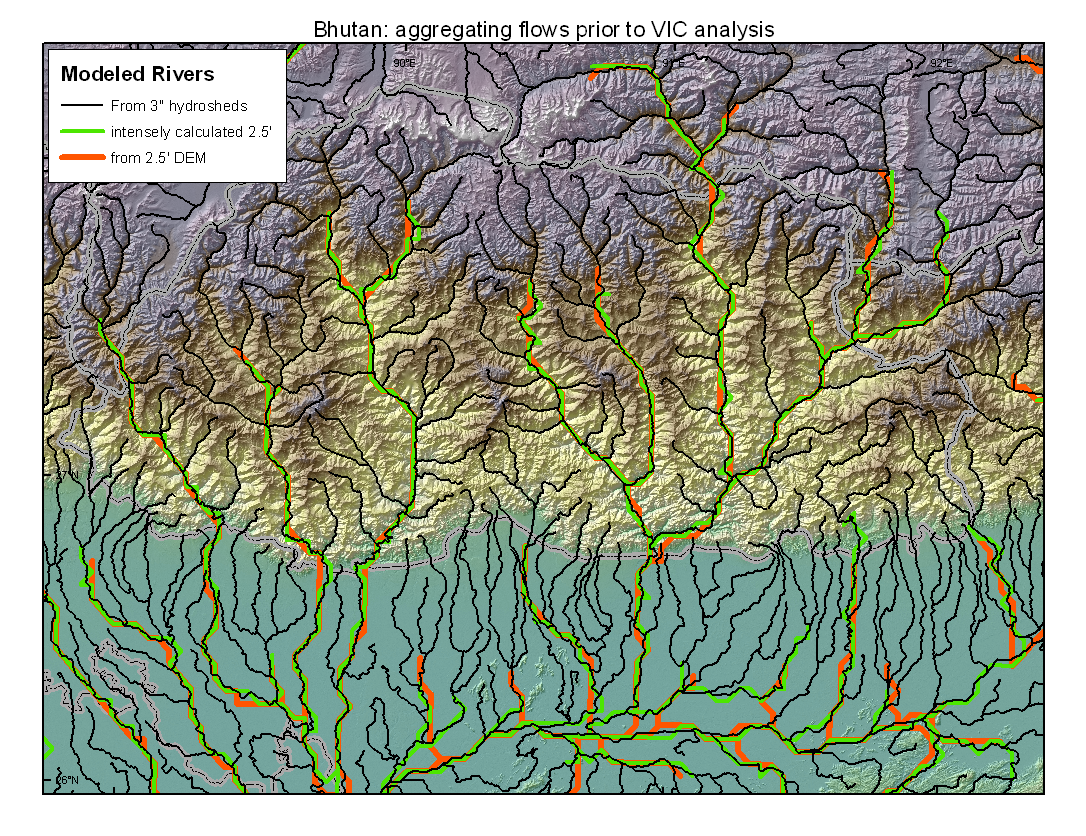
We have implemented the best possible flow direction grid as follows:
- We begin with the hydrosheds conditioned flowdirection grid. This is
derived from the SRTM 3" DEM, modified with the aid of mapped rivers.
- Mean annual TRMM rainfall is summed down this network to yield discharge.
- For each 2.5' block of 2500 small cells, every flow that leaves the
block is traced up to 31 steps to determine it's destination.
- Net flows are calculated, and the maximum value is used to set a
flow direction on a coarse scale.
The resulting flowdirection grid following the rivers much better than a
grid derived from a DEM, even our DEM, as the next figure indicates.
 --------------------------------------------------------------------------------------------
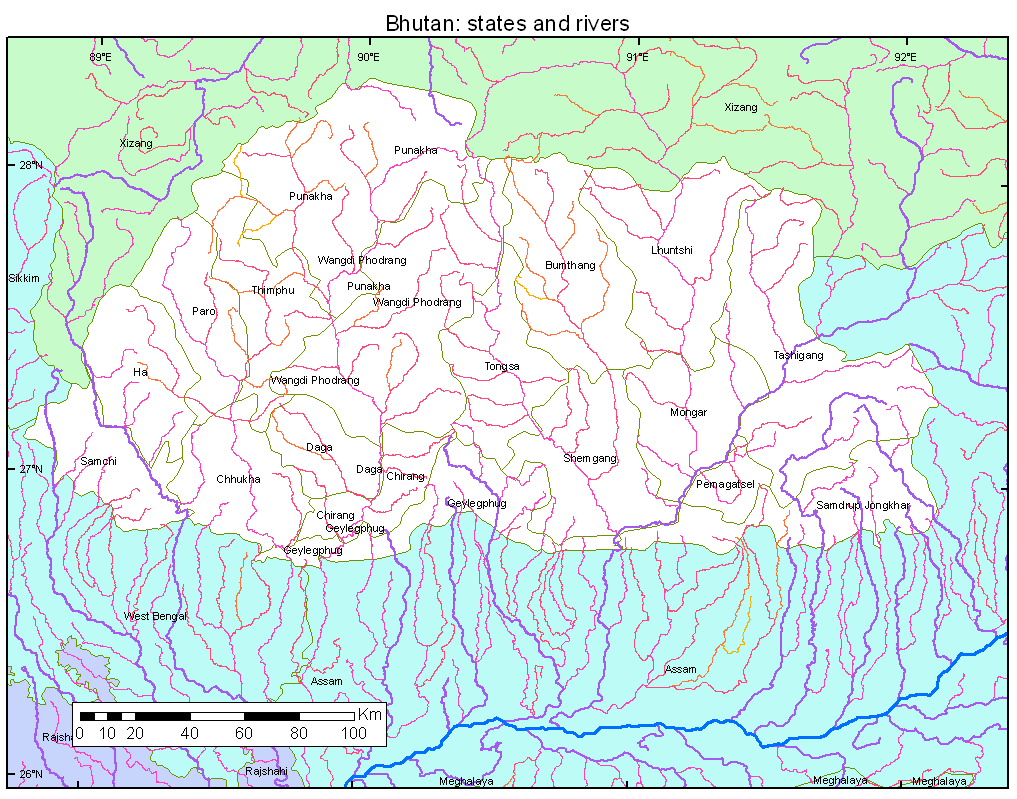
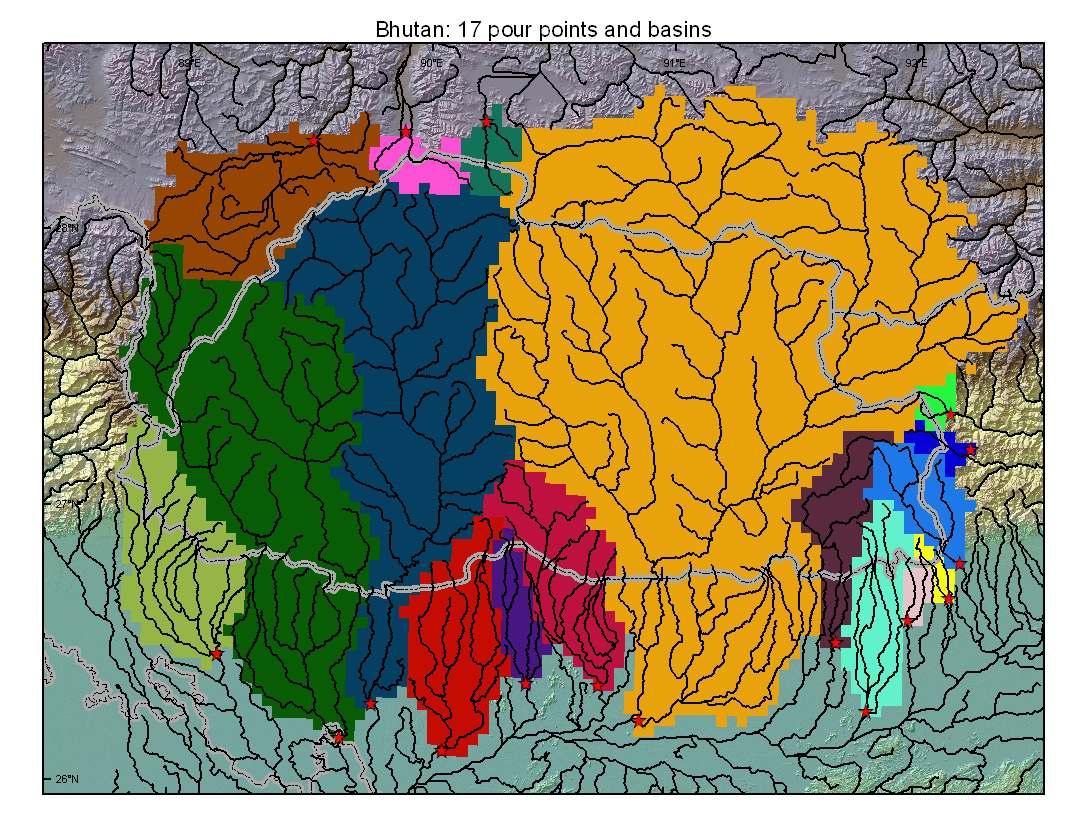
A small portion of Bhutan drains north into the Tsangpo, reaching the
Brahmaputra the hard way. Most of Bhutan drains south across the Indian
plain, reaching the Brahmaputra through a number of rivers.
In order to avoid modeling most of the Brahmaputra in order to cover
Bhutan, we have defined 17 basins:
 -----------------------------------------------------------------------------------------
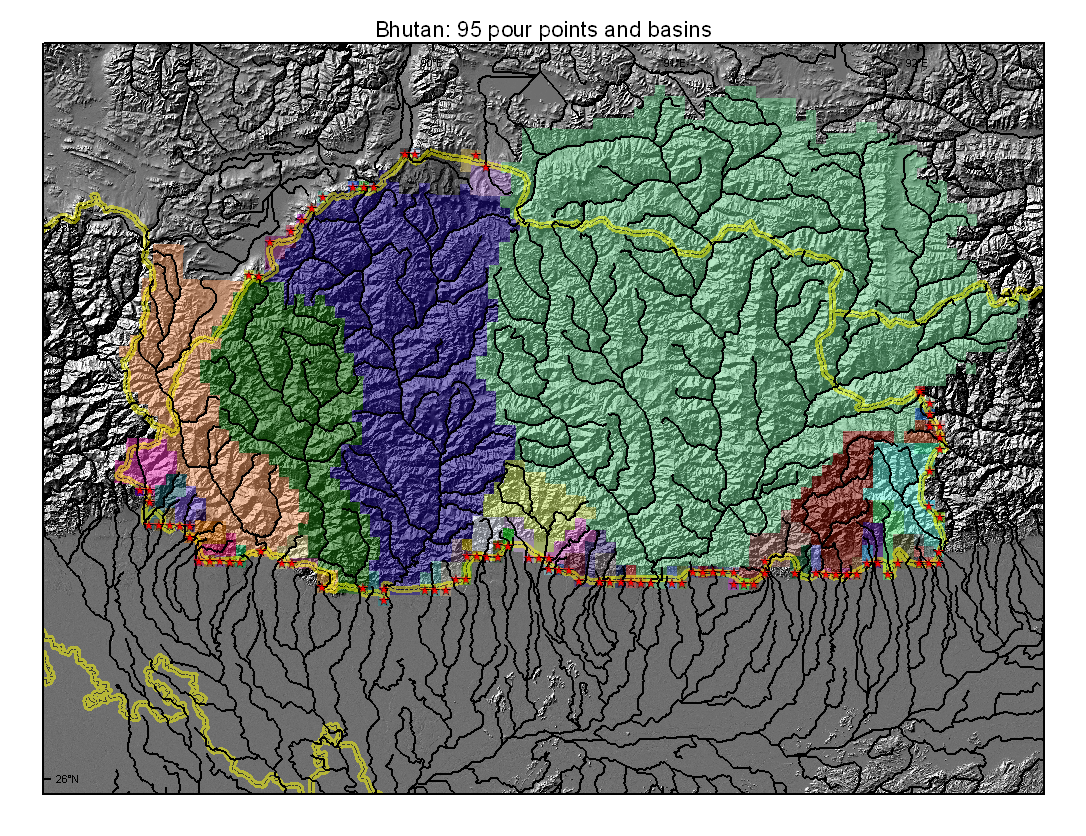
An alternative is to clip the basins as they leave Bhutan. This generates 95
watersheds of 1 to 199 cells, covering the 2225 cells of Bhutan (including
every grid cells that touches Bhutan), plus 682 cells that are upstream from
Bhutan.
This raises the question: what data layers need to extend throughout watersheds
that flow into Bhutan. Also, do we want to extend some watersheds into India
to reduce the number of watersheds and employ Indian river measurements.
 -----------------------------------------------------------------------------------------
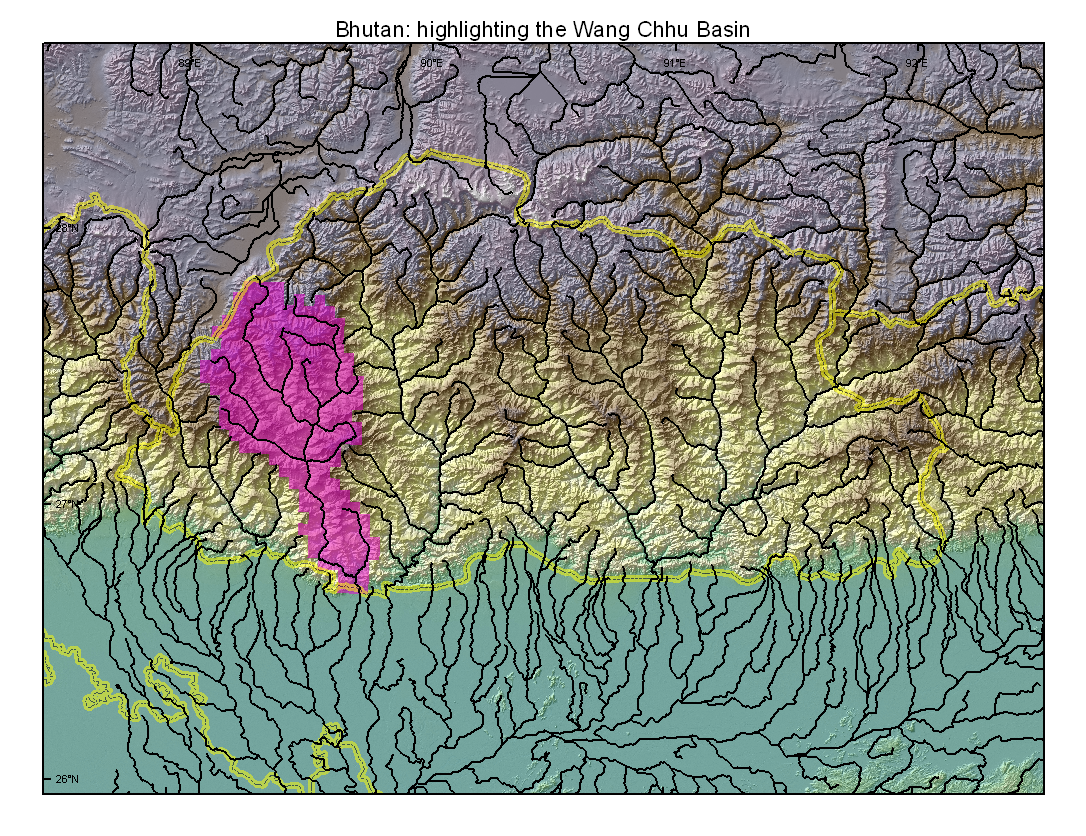
This is the Wang Chhu Basin, as represented in 2.5' VIC-ready cells.
 -----------------------------------------------------------------------------------------
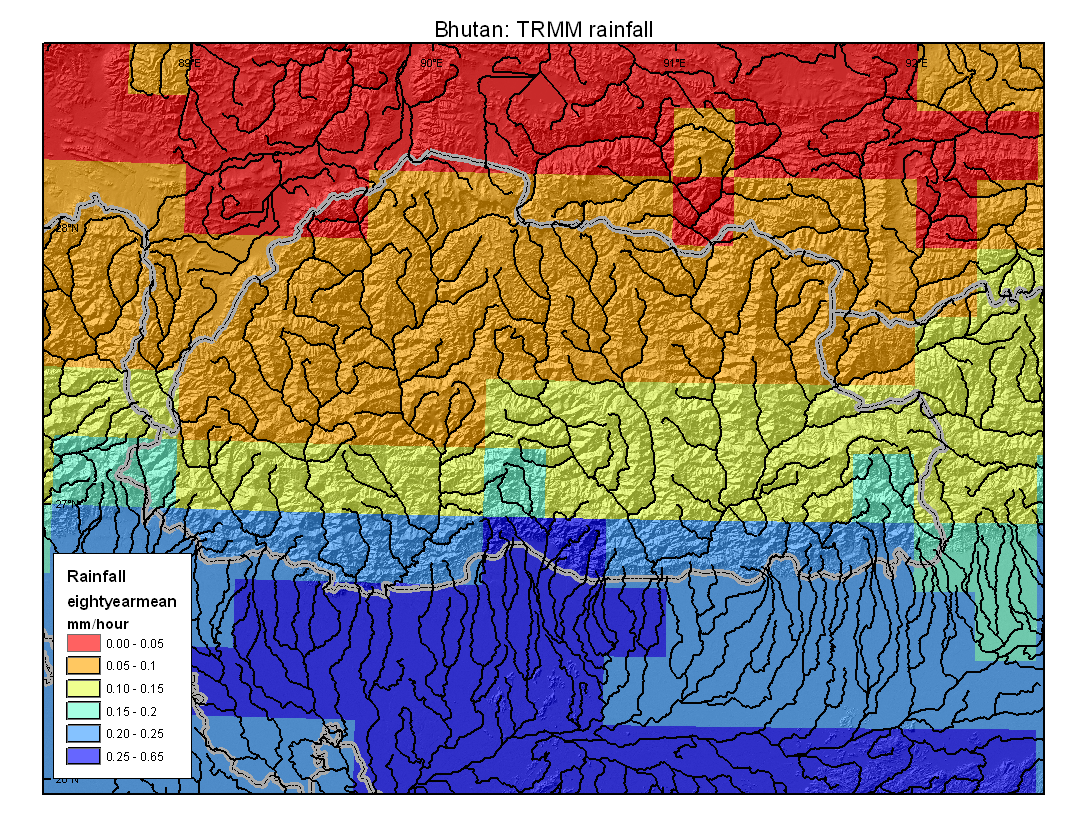
We have TRMM rainfall on a quarter-degree grid at daily (actually 3-hour)
intervals.
 -----------------------------------------------------------------------------------------
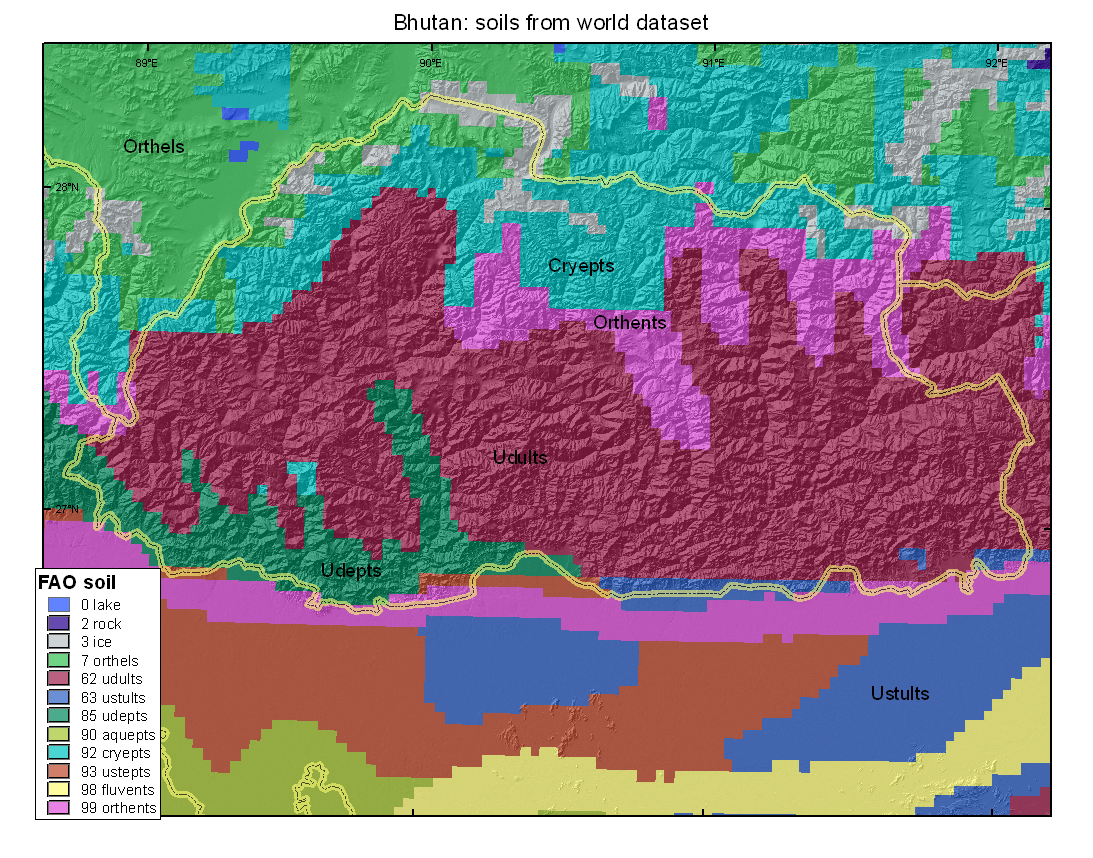
This is the FAO world soil suborder data:
 -----------------------------------------------------------------------------------------
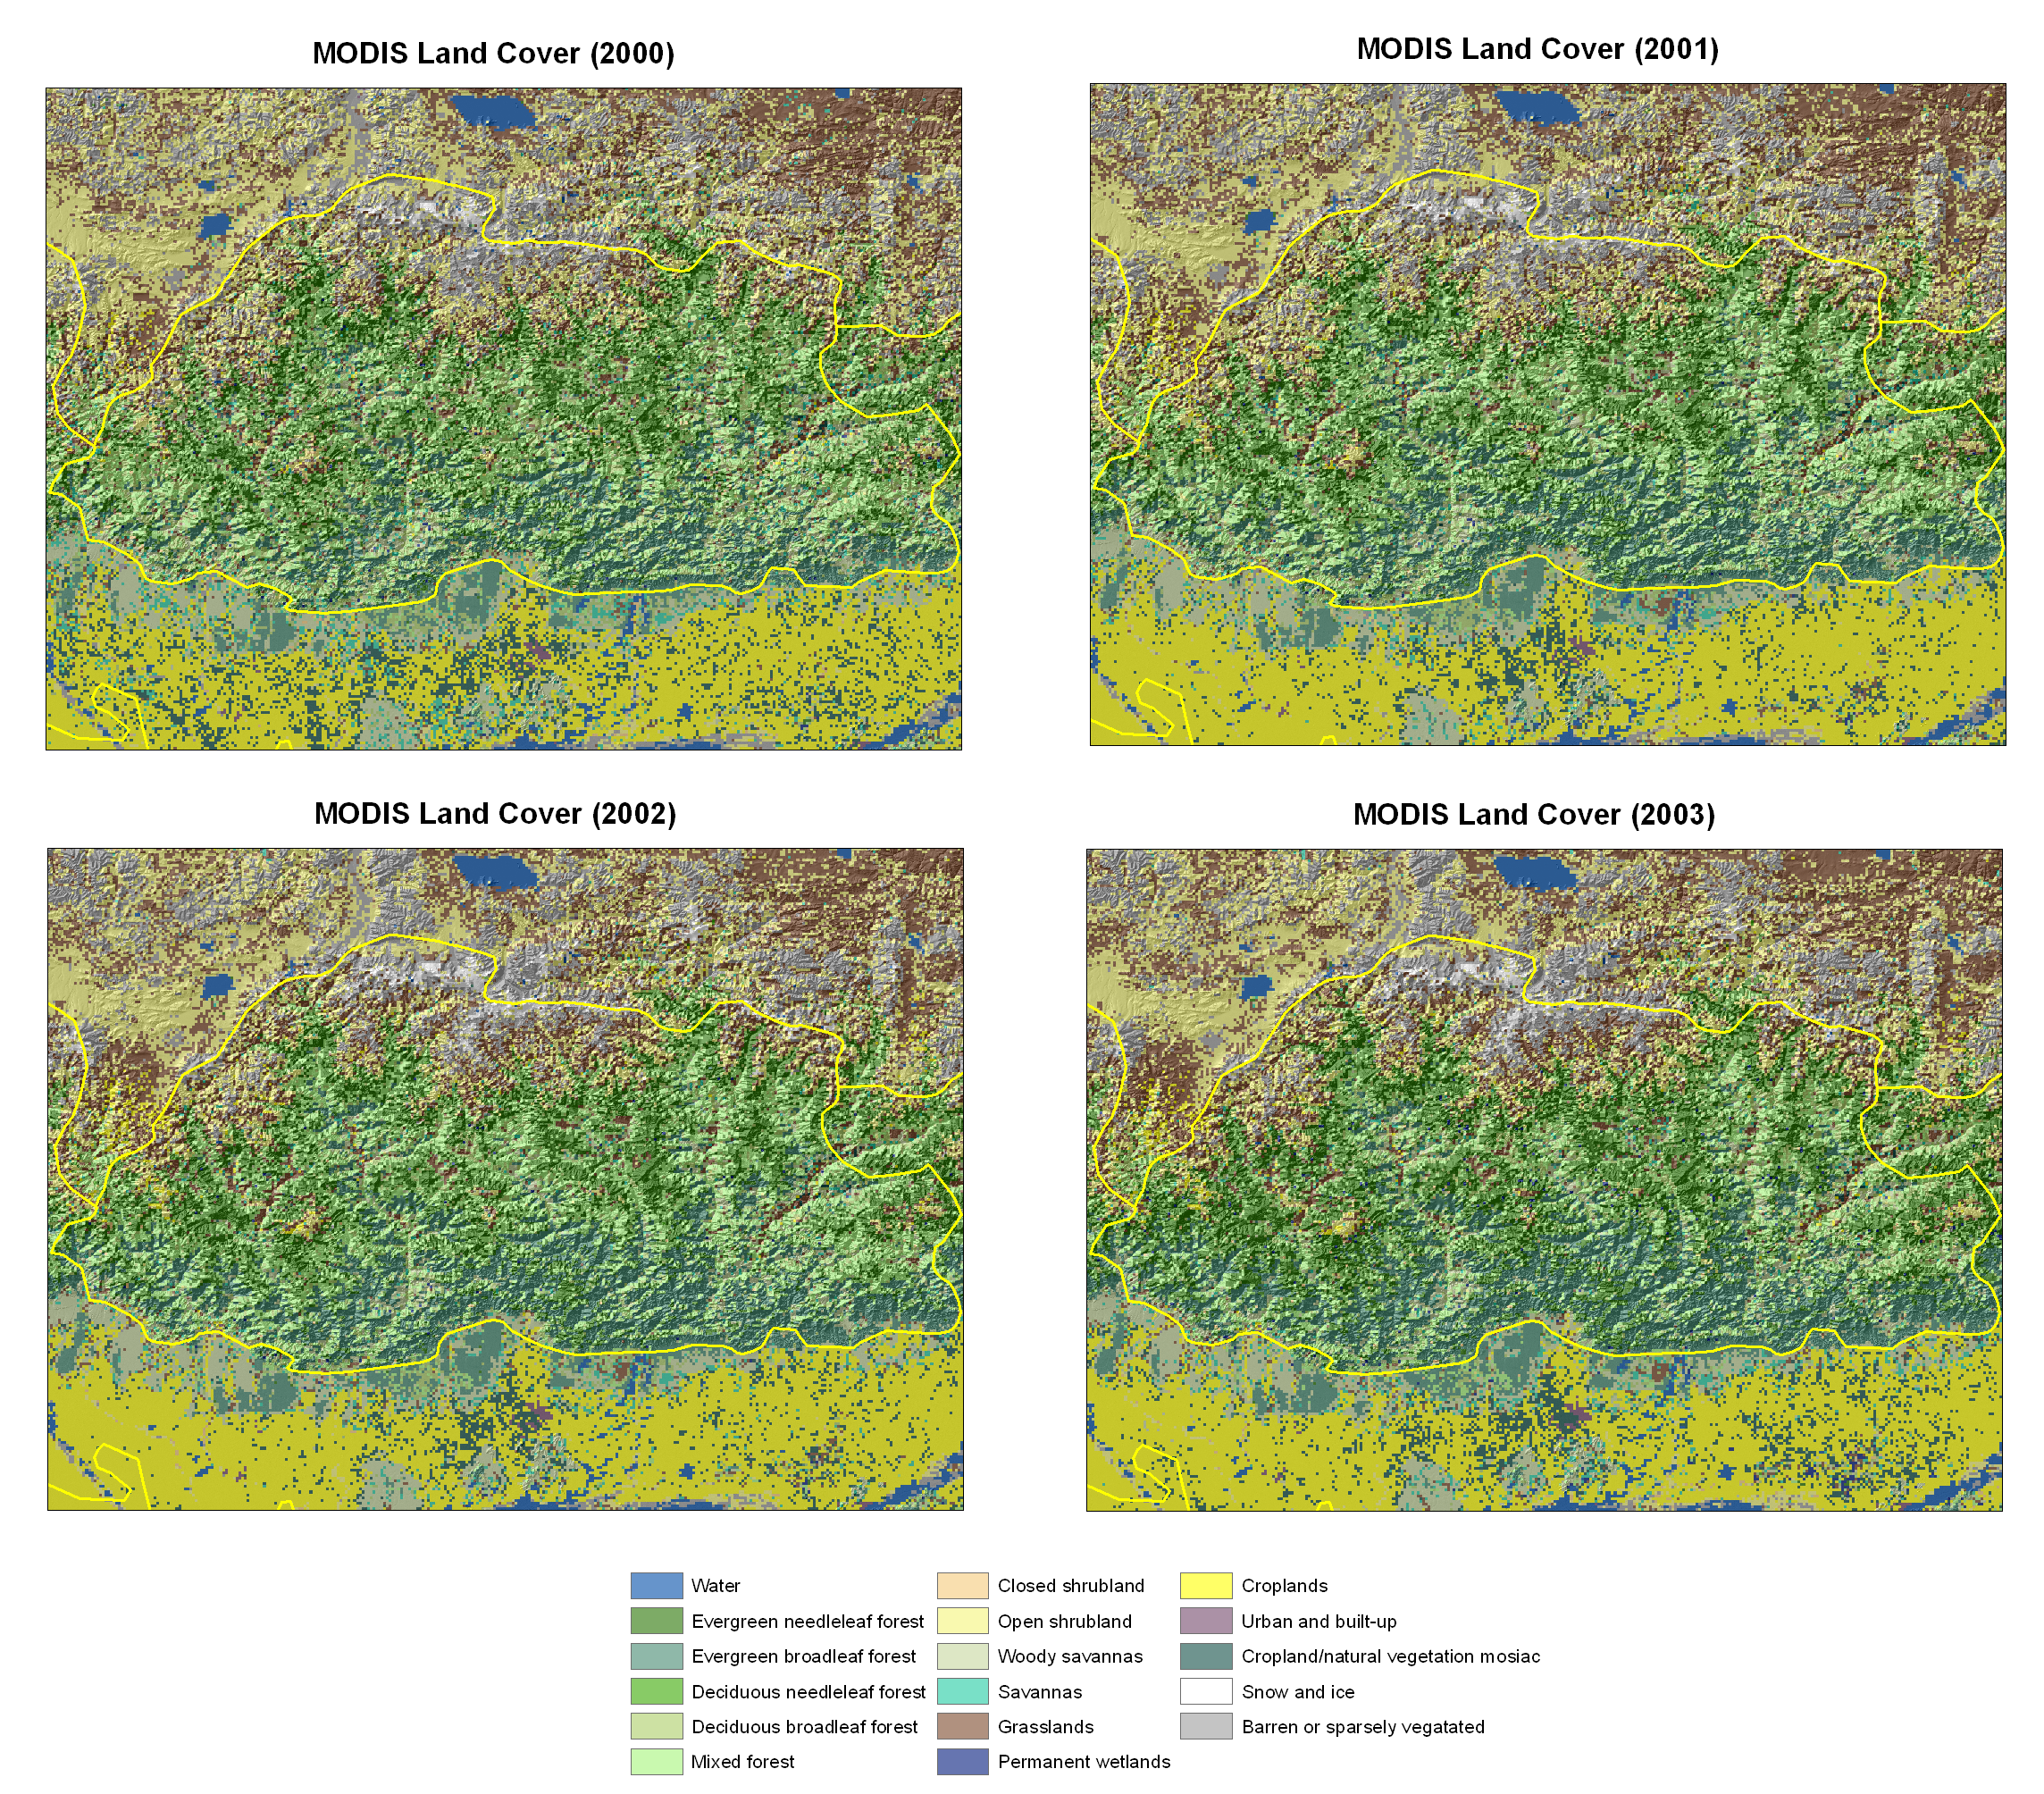
This is MODIS satellite land cover.
( (full size maps))
 -----------------------------------------------------------------------------------------
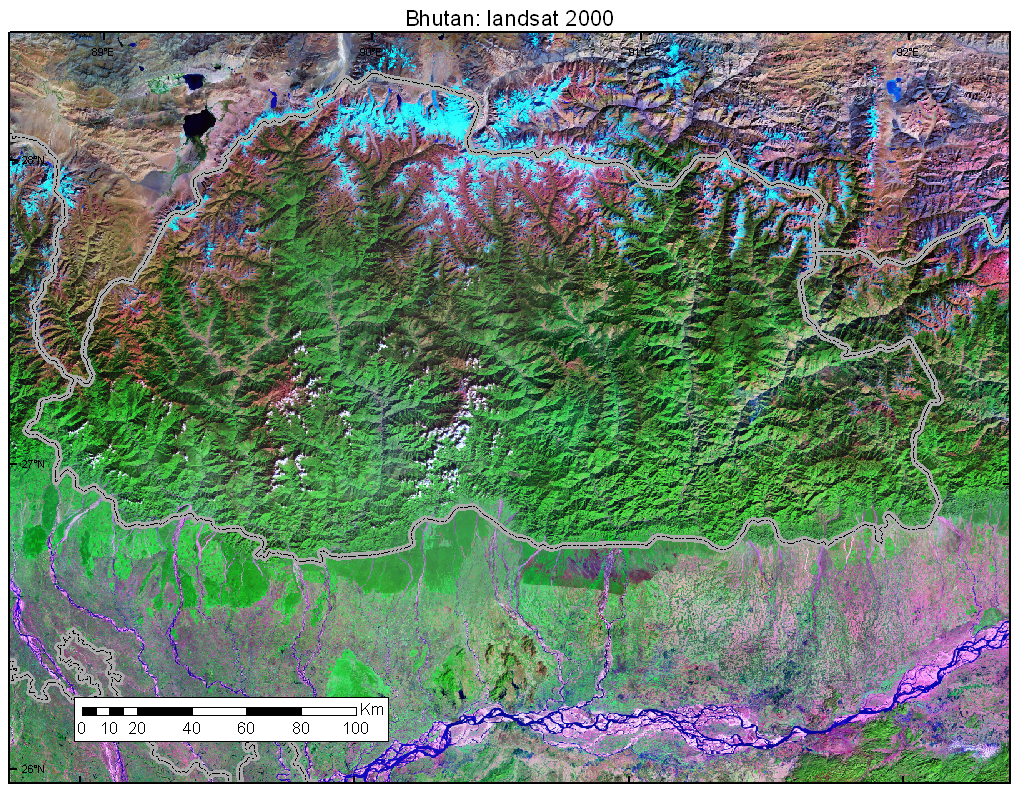
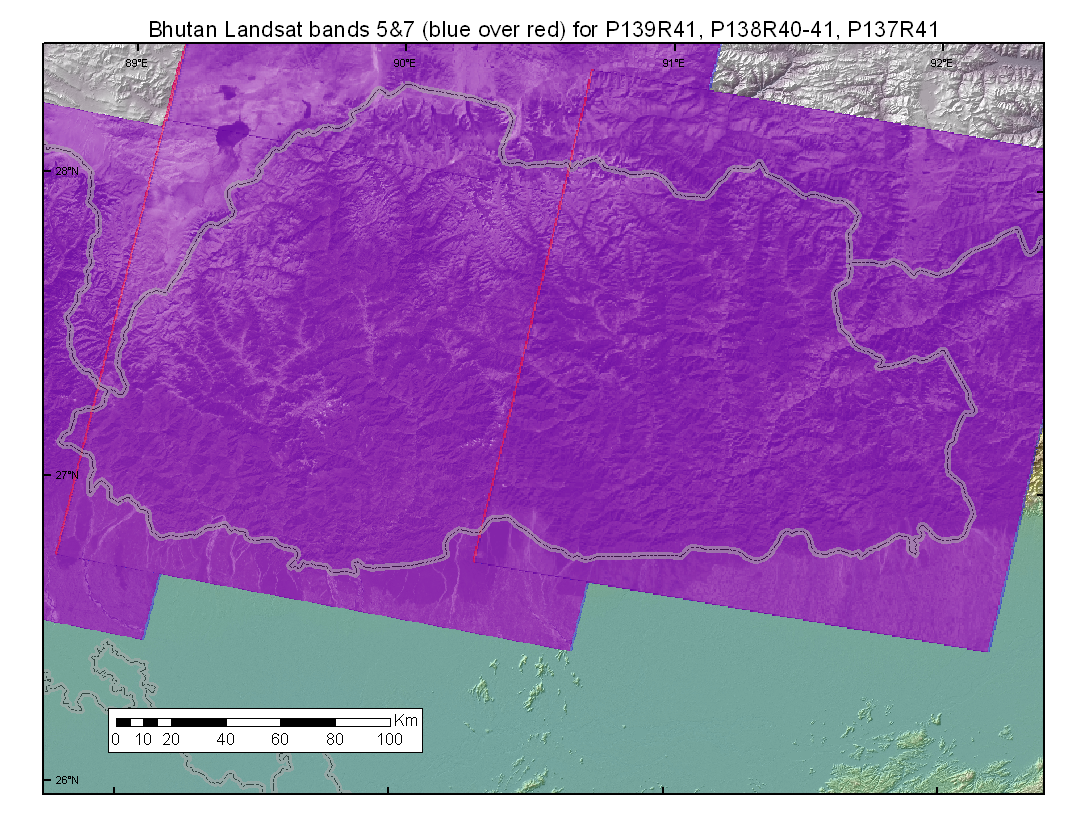
This is Landsat imagery. Two scenes cover nearly all of Bhutan, but two
more are required to cover the entire country.
 -----------------------------------------------------------------------------------------
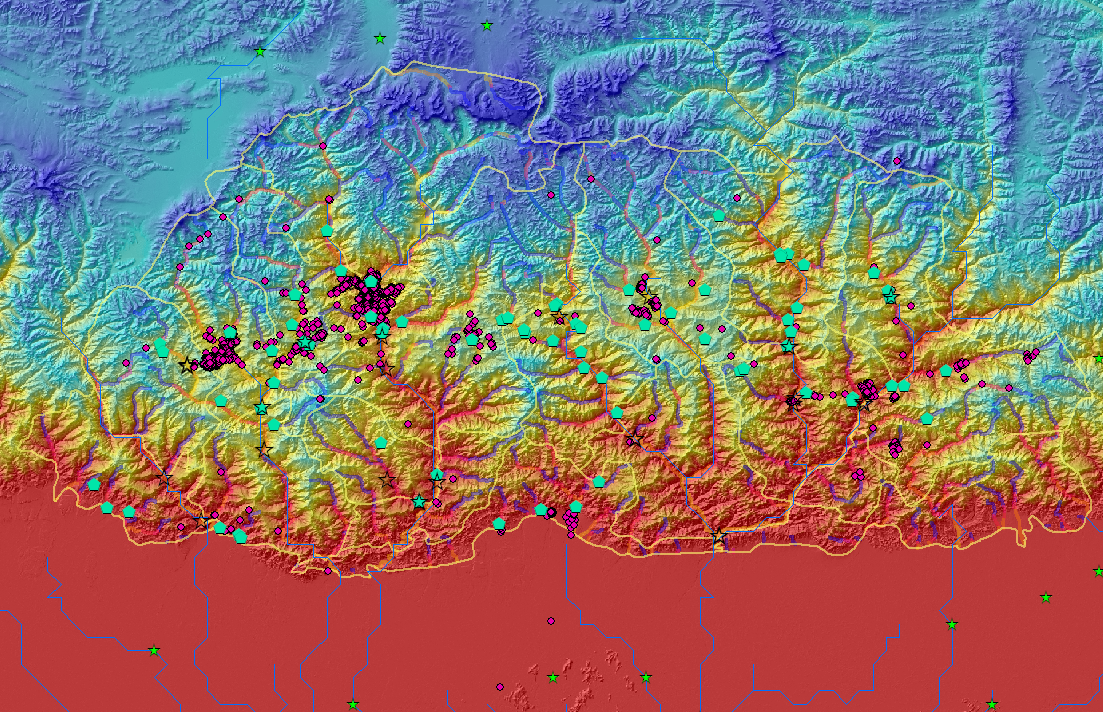
The stars and pentagons represent river flow stations for which monthly
and daily data have been assembled.
 -----------------------------------------------------------------------------------------
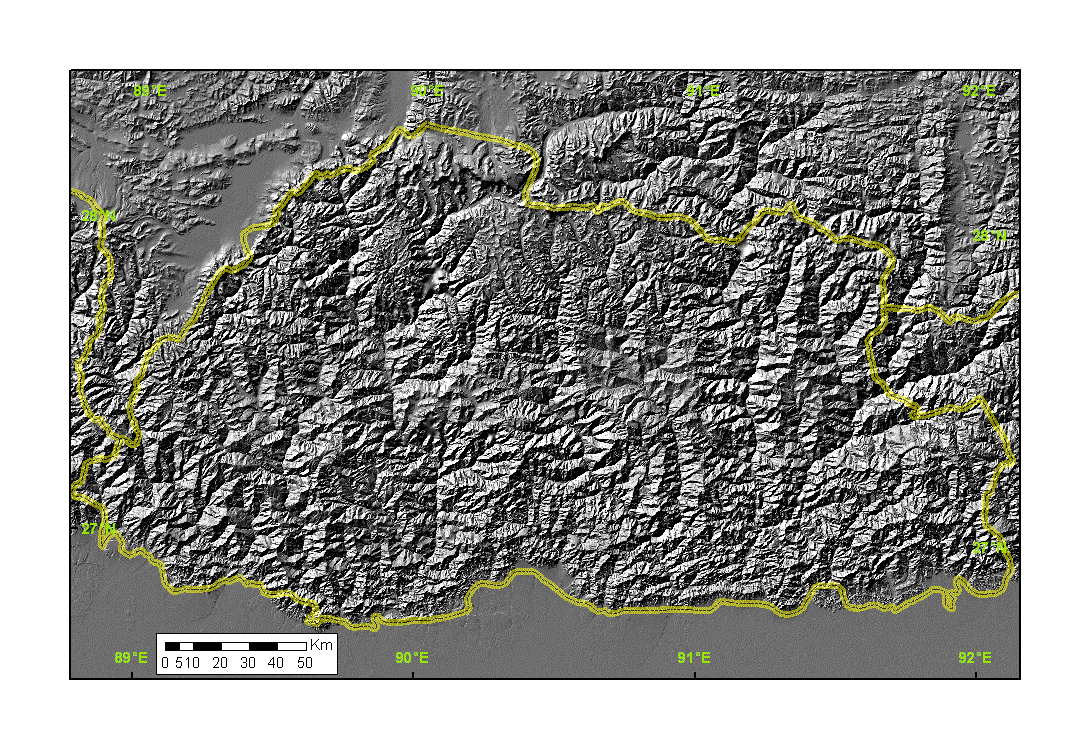
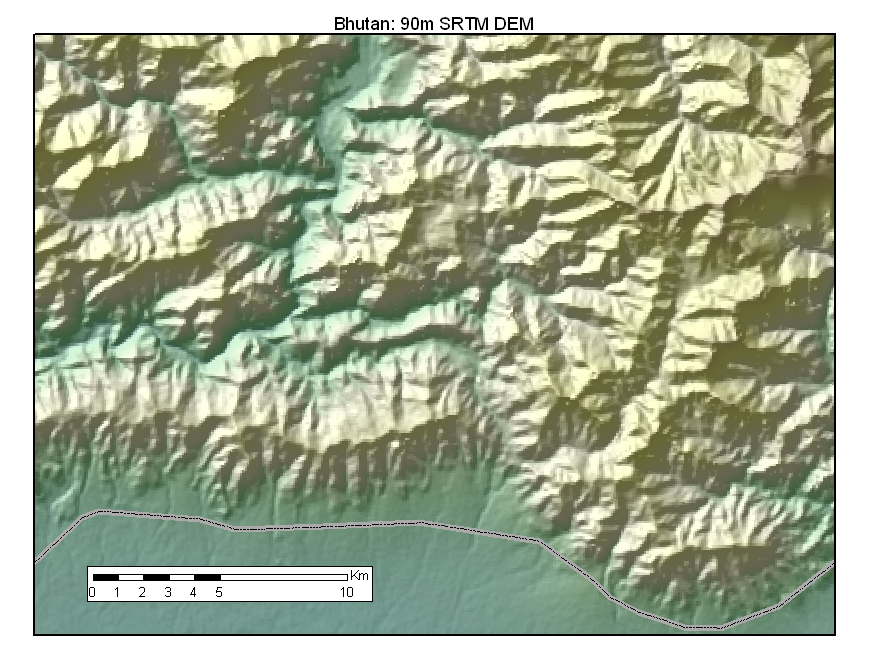
This shows a detail of the 3" (~90m) SRTM DEM from the 2000 Space Shuttle
flight. This is the CGIAR conditioned version.
 -----------------------------------------------------------------------------------------
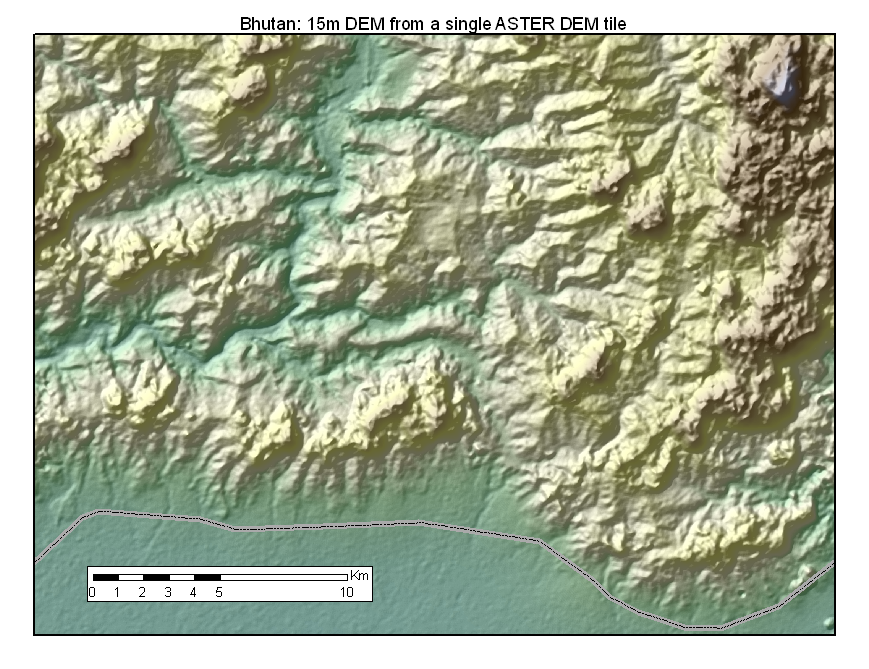
This shows a detail of a DEM built from a single ASTER satellite scene.
The scene contains 14 sprectral bands, along with a backlooking band
which we used to create the DEM shown here.
Clouds to the right have been mistaken for topography.
 -----------------------------------------------------------------------------------------
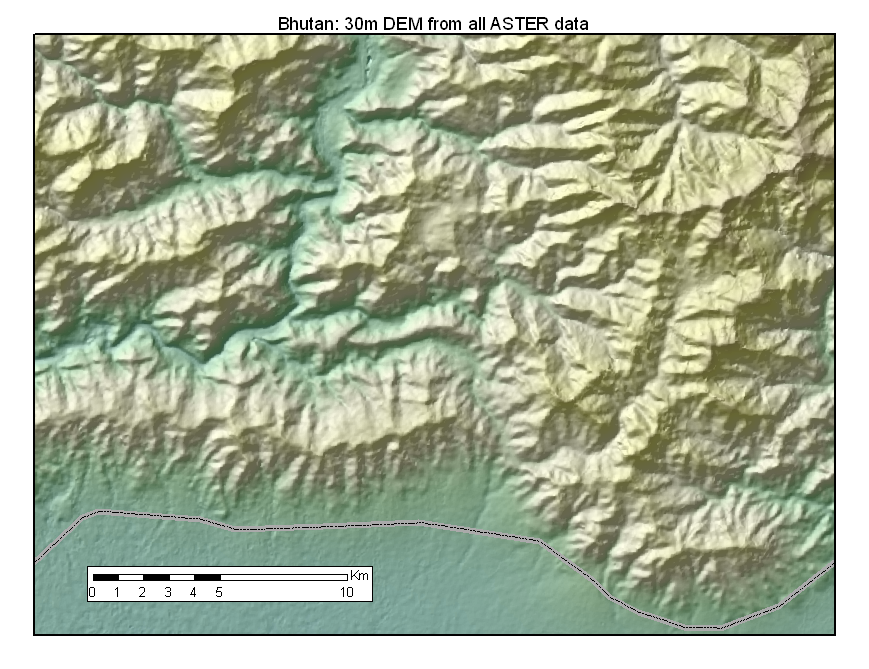
This shows a detail of the new (July 2, 2009) Global DEM mosaicked from 1.2
million ASTER scenes. It is built at 1" (~30m) resolution.
ASTER DEM is a product of METI and NASA.
 -----------------------------------------------------------------------------------------
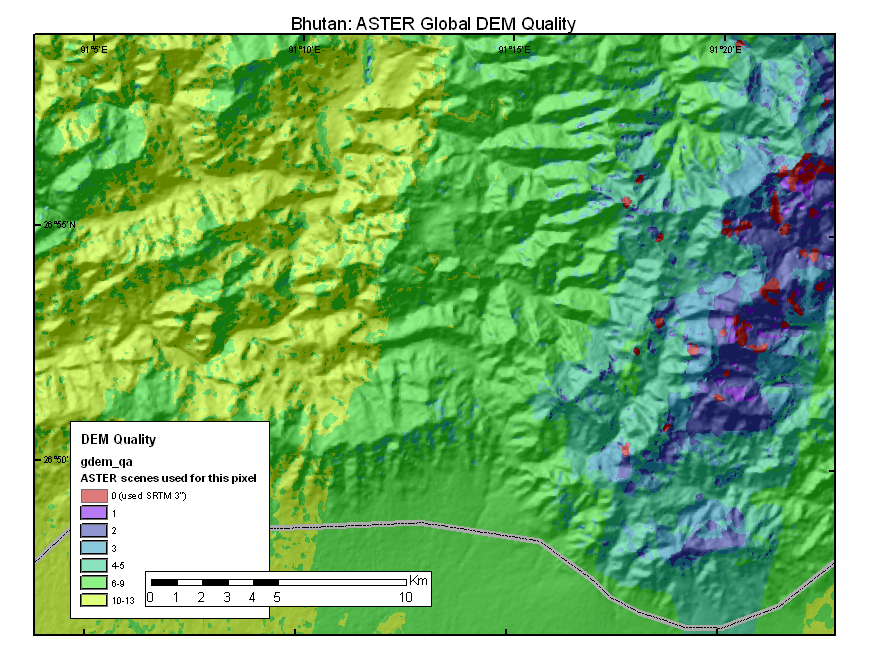
This shows the number of ASTER scenes combined to obtain a value for each pixel.
The maximum number of component scenes in the Bhutan area is 58.
 -----------------------------------------------------------------------------------------
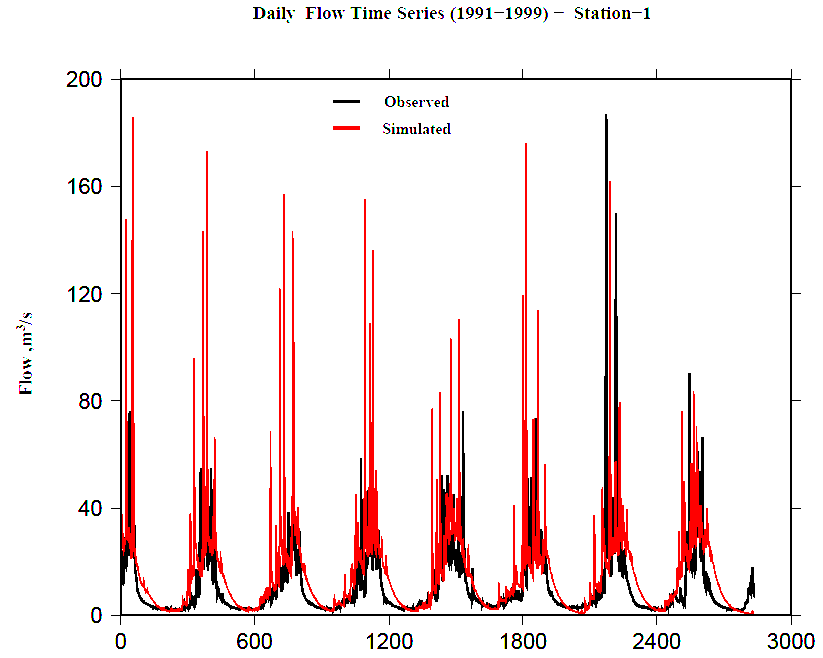
This is one of the preliminary VIC hydrographs.
 --------------------------------------------------------------------------------------------------------------------
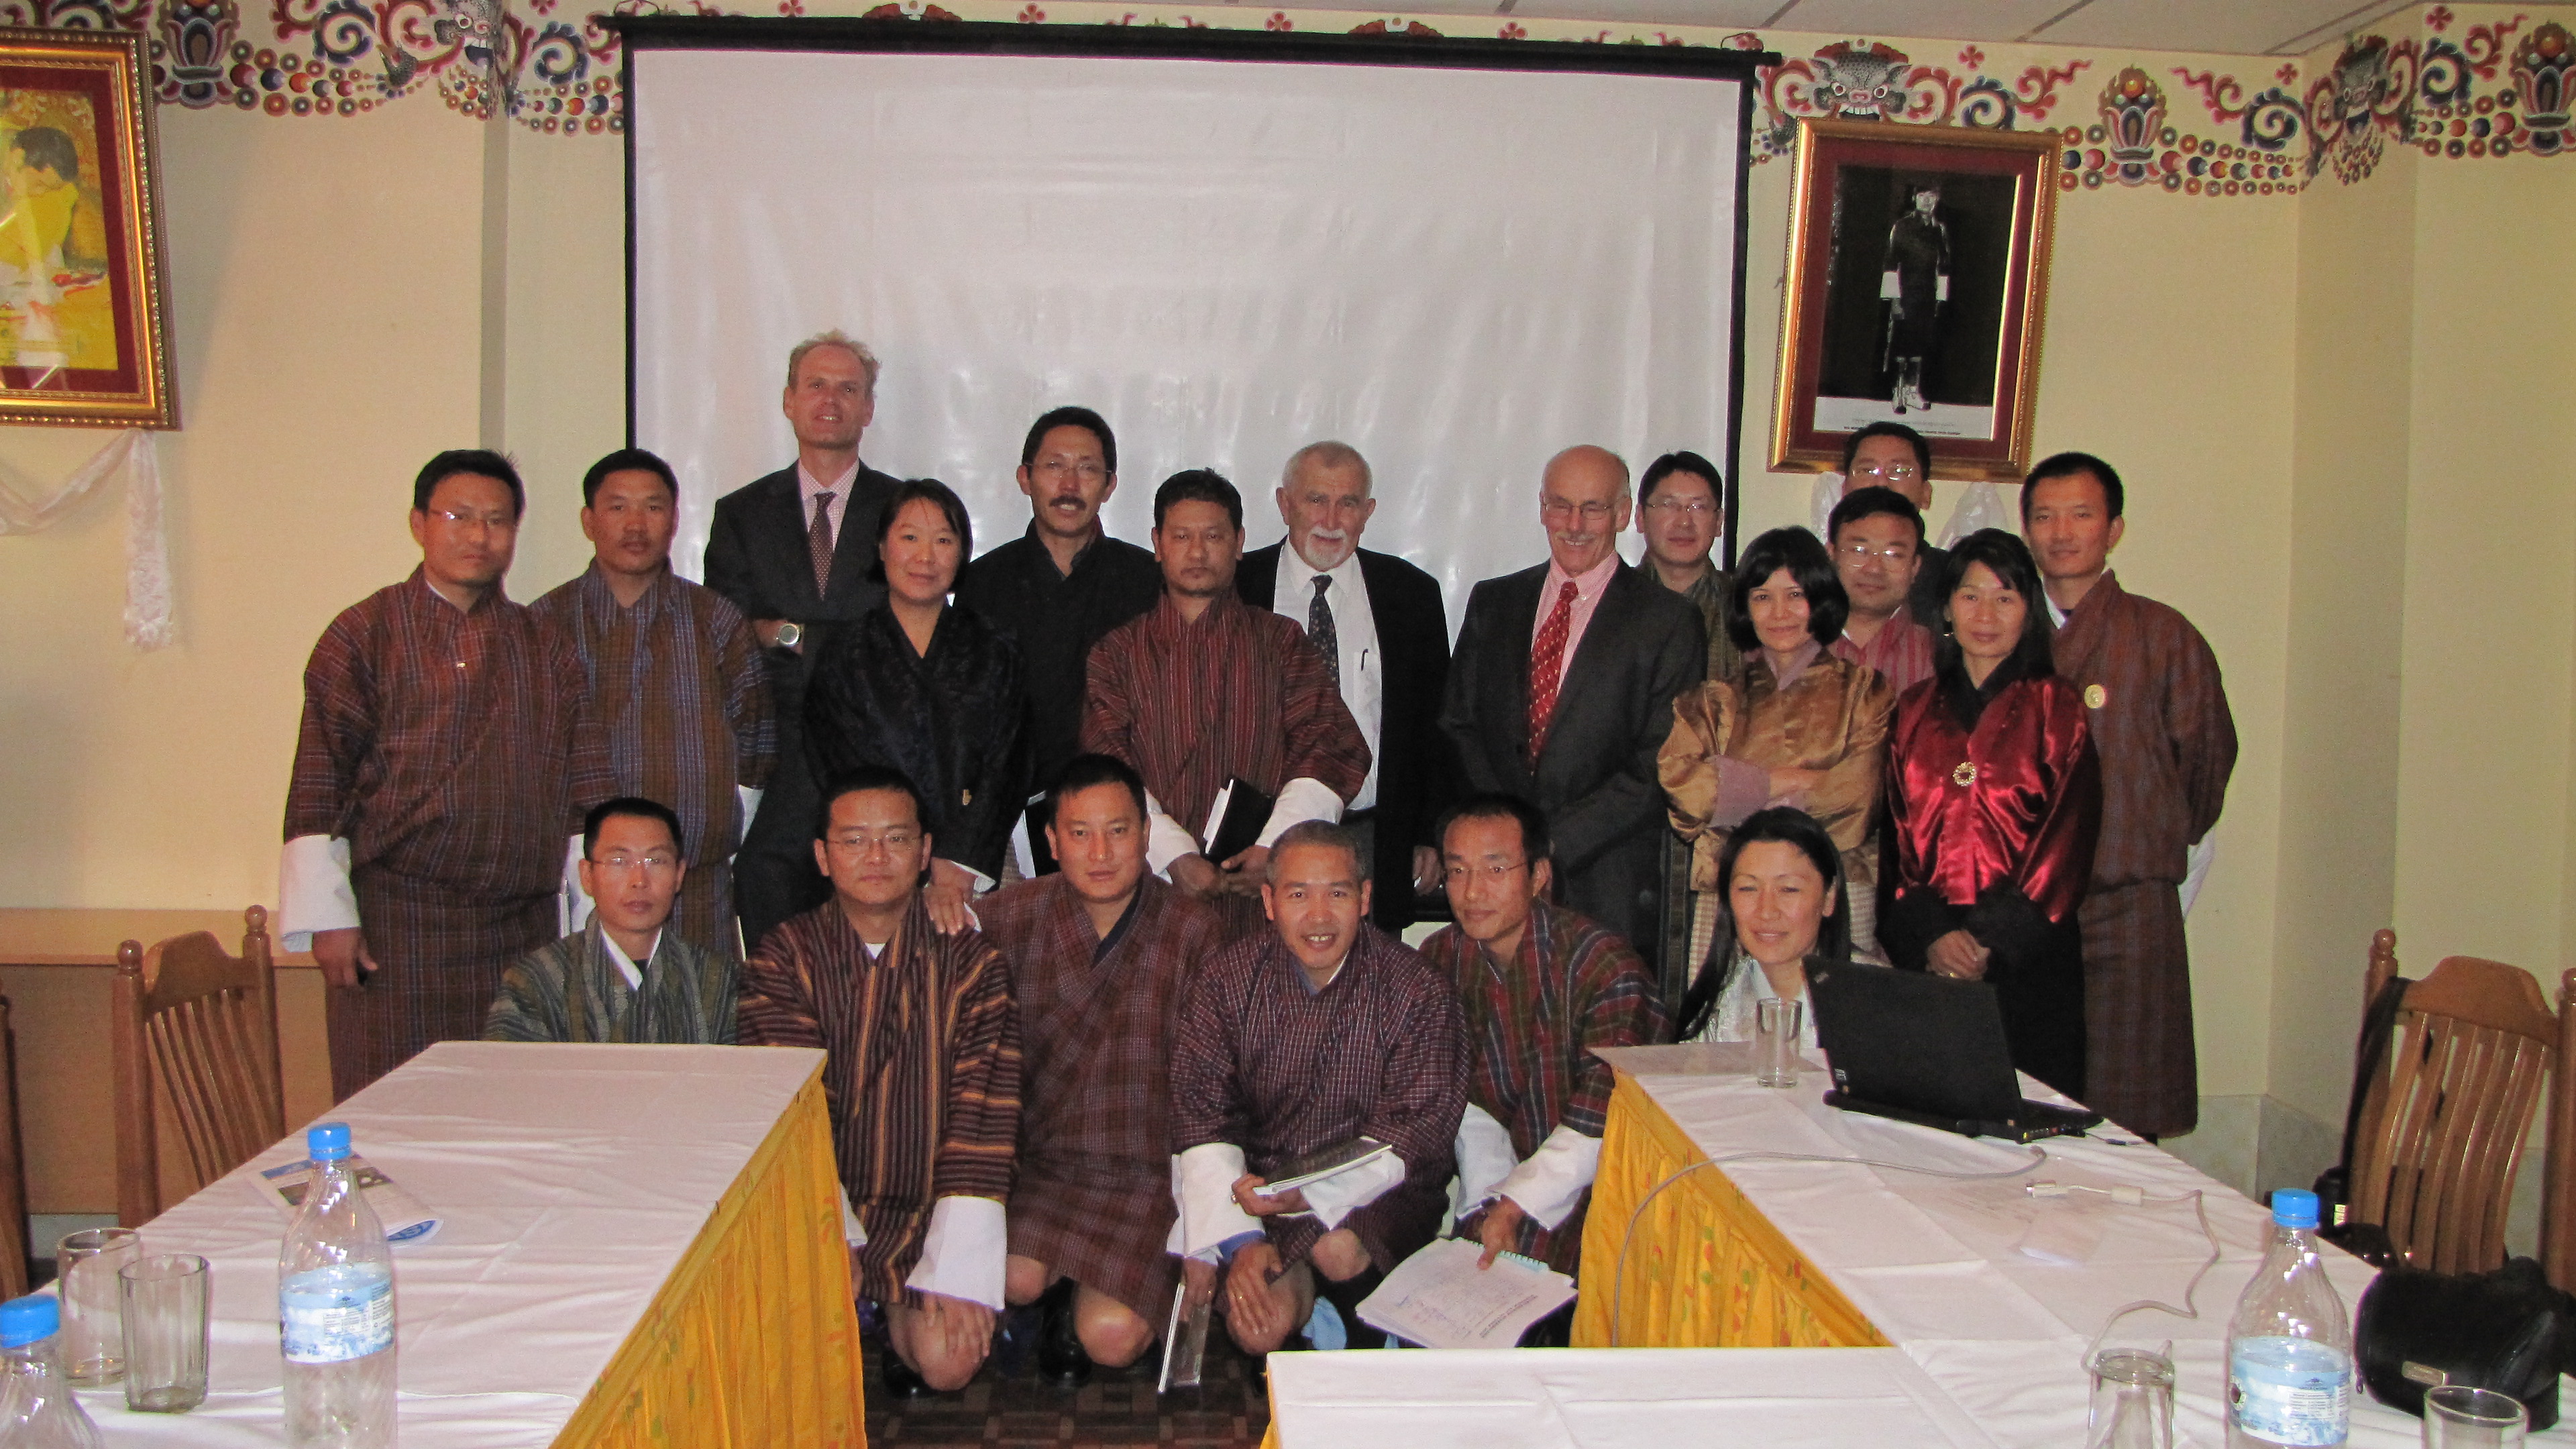
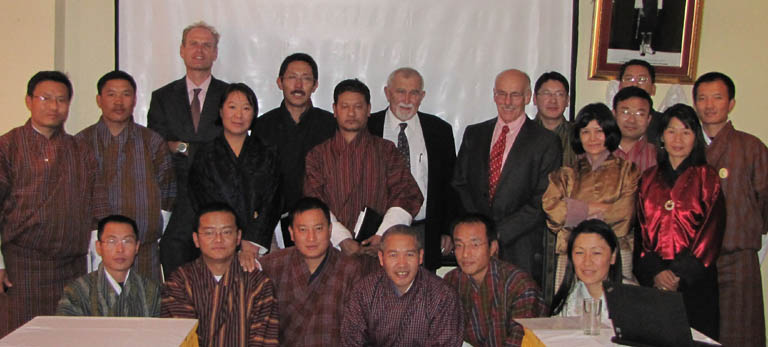 October, 2009 workshop in Thimphu
(full size)
October, 2009 workshop in Thimphu
(full size)
This site grows frequently.