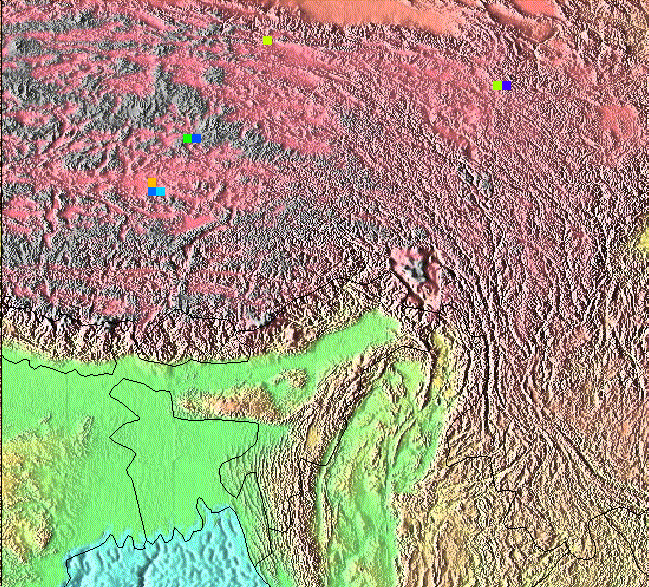
Wet Spots in SE Asia


We have some curious results in the rainfall grid built from TRMM TMI data. This image shows three cells in Tibet from January 1998 (the lower left bunch) and five cells from November 1999 that show more than 5mm/hour average rainfall for the month. The max is 12.161 mm/hour (9047mm total). This value is based on 1334 samples (ranging from 0 to 50mm/hour) from 102 satellite tracks spread fairly evenly through the month.
Here are the monthly spatial mean and spatial maximum rate (mm/hour) for our study area.
.114  12.161	jan1998
.143   7.329
.150   4.123
.198   3.037
.279   3.659
.346   4.145
.316   3.377
.277   3.934
.308   3.784
.312   3.100
.292   8.359
.259   5.768
.219   4.035	jan19999
.173   3.470
.223   3.706
.260   2.973
.297   3.763
.296   3.288
.312   3.355
.306   4.605
.259   3.695
.283   3.332
.232  11.139
.268   8.649
.208   7.496	jan2000
.222   3.566
.207   3.055
.244   3.307
.290   3.947
.333   3.850
.291   3.638
.302   3.056
.260   4.109
.296   2.953
.244   3.022
.240   3.910
.235   3.306	jan2001
.194   3.138
.214   3.398
.216   3.316
.269   3.671
.323   3.802
.264   2.665
.252   3.771
.268   3.813
.258   2.829
.278   3.402
.175   3.027

.254   4.267	4-year mean
main TRMM page

Questions: Harvey Greenberg