Snoqualmie River

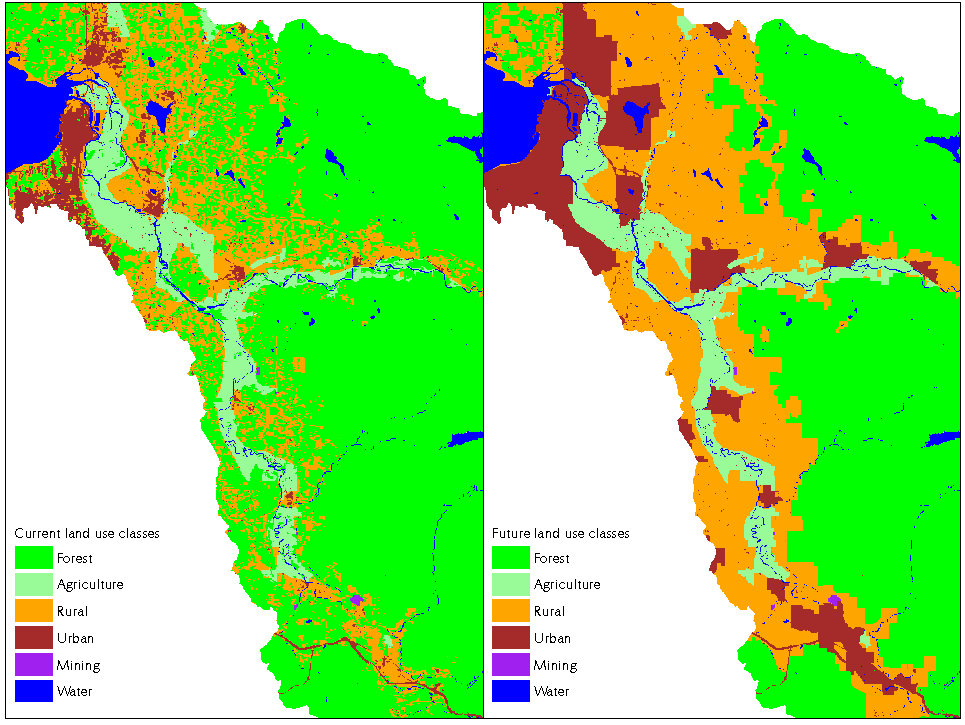
Dave, is this the image you want?
LIDAR

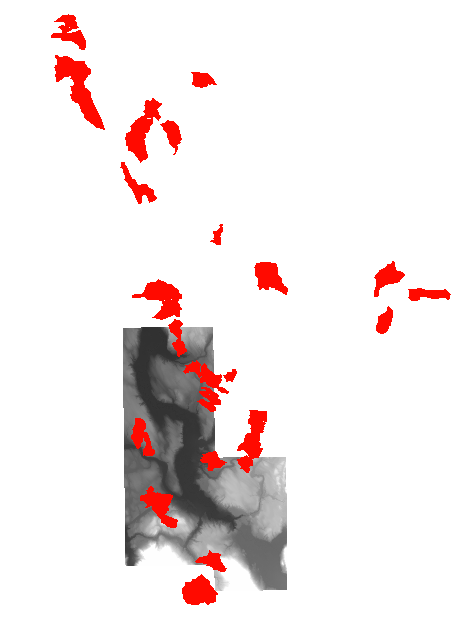
This shows the current (provisional) LIDAR coverage, plus the 53 basins
that went into the 1999 atlas. Here are the
export files for those basins.

This is a test of how a LIDAR DEM can be used to calculate small catchments.
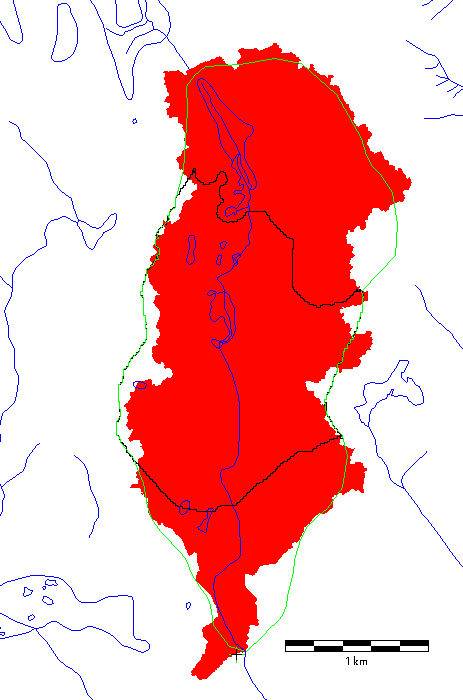
This is basin 28.
The blue lines are the DNR hydro coverage.
The black line is the basin boundary as calculated from the 10-meter DEM.
To get anything meaningful, I had placed the "outlet" 1200 meters upstream.
The green line is the boundary as I sketched it in, guided by the black
polygon, the rivers, and contour lines.
I moved the LIDAR pour point 70 meters from George's pour point to the
spot marked by the cross. The resulting calculated basin is shown in red.

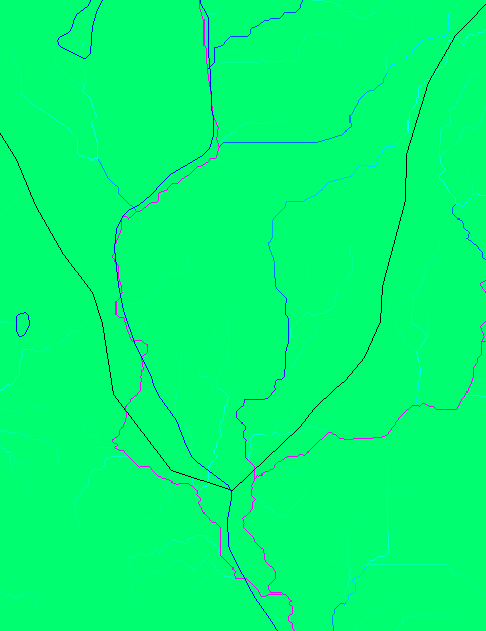
This is a blowup of the basin outlet, showing calculated streams, based on
LIDAR.
Everything below this line dates back to 1999.
Blake, this file unzips to a workspace containing
1) Two coverages and the arplot macro to make the productivity plot,
2) a postscript file of the plot.
3) Bonus: 4 .gra files (r5,r14,r25,r28) showing how I built catchments for those reaches.
Harvey Greenberg


