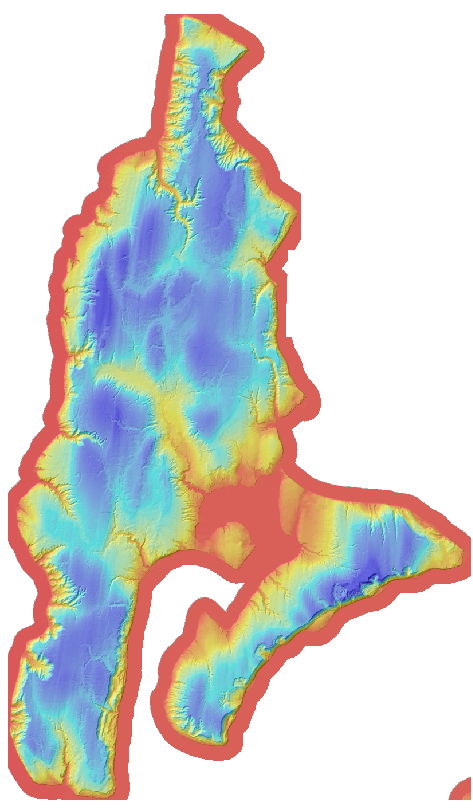
Data is rasterized to 3-foot resolution in the State Plane North (NAD_1983_HARN_StatePlane_Washington_North_FIPS_4601_Feet) coordinate system. Data enthusiastics can download the point data from the PSLC site. This is "bare_earth" data. You can find first-return rasters (showing treetops and such) at the PSLC site. This image shows the color-coded elevation transparently draped over a "hillshade model" which shows how the topography would—if it had a uniform texture and albedo—look if the sun were (impossibly) at an elevation of 45 degrees in the northwest.
Hillshade DEMs are always one pixel smaller than the DEMs from which they are made. As hillshades were calculated separately for delivery 1 and delivery 2, and as there was no overlap between the two rasters, the careful observer will see a two pixel gap in the shaded relief image at Point Beals. The hillshade image does not contain a color table, but simply represents brightness with values from 1 to 254. No-data is represented as 0. Is that okay?
Hillshade images can look muddy when you are zoomed out and one screen pixel represents many data cells. ESRI's ArcMap software can solve this problem by constructing low-resolution "pyramids" with bilinear interpolation. The bilinear algorithm is not the default.
Standard 1064-nanometer lidar does not readily distinguish land from water. This survey was clipped with buffer around the mapped shoreline. If you manipulate the color table, you can see how the tide ebbed and flowed over the course of the survey.
The bare-earth image can be seen with any image-viewing software that does not choke on the size. The elevation raster has 32-bit floating point values, and can be read by matlab and GIS software. Both files know both their projection and the conversion from row-col to northing-easting. GIS software will place them on the map correctly. Most data is delivered to the PSLC with tiled rasters, but that was not done for this survey. Appeal to Harvey if this is a problem. You can download the 325,709,903-byte DEM and the 107,374,034-byte hillshade.