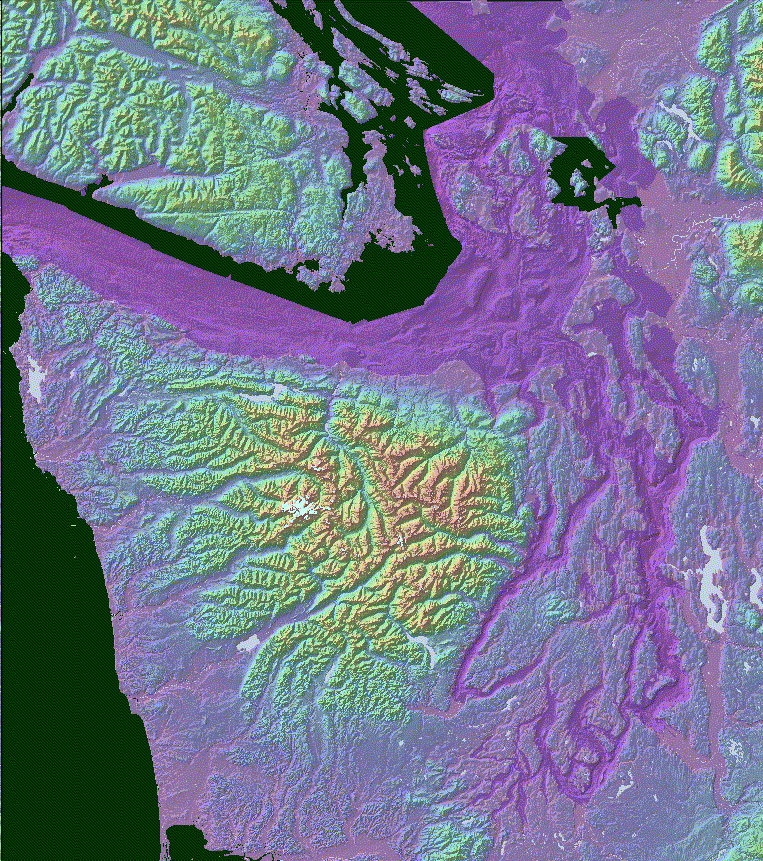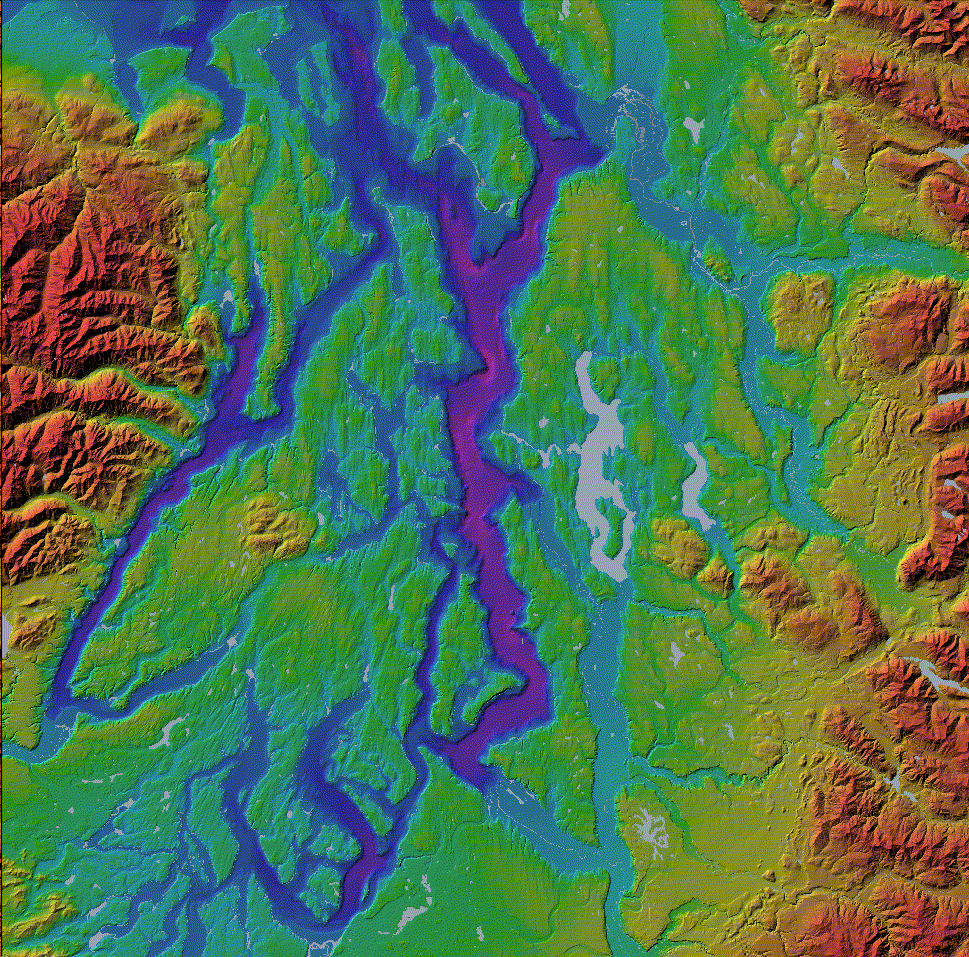
and here's a  vivid image for Kathy
WARNING THIS IS OLD DATA! SEE
NEW DATA
What we have done has been to:
- Obtain all 10-meter USGS DEMs from Puget Sound to the Pacific, mosaicking
them a fixing the few gaps, and settting any values less then zero to no-data.
- Obtaining data for all available tide stations to determine the difference
between the hypsometeric datum and the bathymetric datum.
- Constructing a "surface" of elevation difference.
- Using all available bathymetric surveys--plus the shoreline--to construct
a bathymetric surface.
- Correcting this surface to the terrestrial datum.
- Merging the two datasets, giving precedence to the terrestrial data.
- Filling in the few holes with zeros.
- Setting to no-data the areas (Pacific Coast, Canadian waters, and an area
including Guemes Channel, Bellingtham Channel, and part of Rosario Strait)
where we have insufficeint bathymetry.
See also the
award-winning David Finlayson's page or download
a half-meg jpeg of his poster.
We need to
- Replace our shoreline with a better one and rerun bathymetry.
- Search for more updates to bathymetry.
- Clip the bathymetry to the shoreline.
- Discard the hypsometry between the lowest contour and the shoreline,
and spline in an improved elevation interpolation
We have begun this process, but it is proving trickier than anticipated.
And we have begun this process again.
Download the data as pictured above.
What you get is a is a file that unzips to a directory named elvbathy.
This directory is an ARC/INFO workspace containing a grid named
october (signifying the october, 2000 version).
The grid is in UTM zone 10, NAD27. Horizontal spacing is 30-meters,
and Z-units are integer decimeters, NGVD29.
Land is positive, water is negative.
WARNING THIS IS OLD DATA! SEE
NEW DATA

 vivid image for Kathy