 |
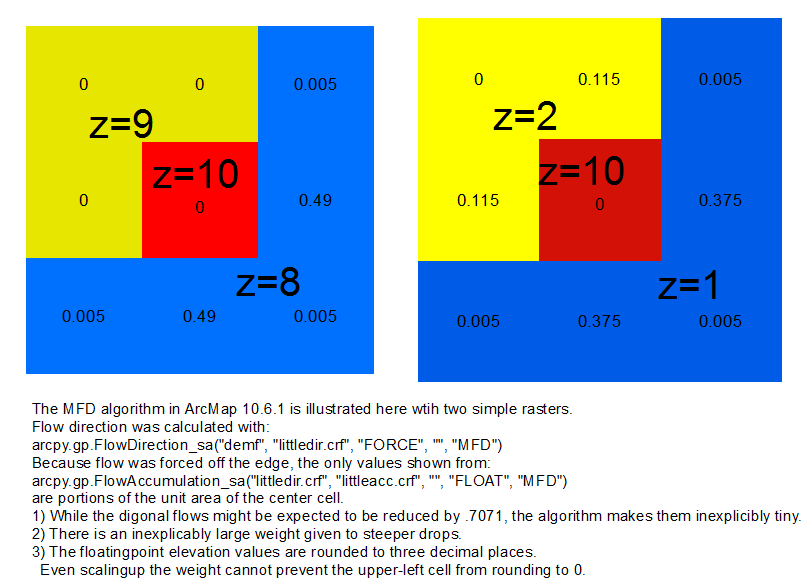
The MFD algorithm in ArcMap 10.6.1 is illustrated here wtih two simple rasters.
Flow direction was calculated with:
arcpy.gp.FlowDirection_sa("demf", "littledir.crf", "FORCE", "", "MFD")
Because flow was forced off the edge, the only values shown from:
arcpy.gp.FlowAccumulation_sa("littledir.crf", "littleacc.crf", "", "FLOAT", "MFD")
are portions of the unit area of the center cell.
1) While the digonal flows might be expected to be reduced by .7071, the algorithm makes them inexplicibly tiny.
2) There is an inexplicably large weight given to steeper drops.
3) The floatingpoint elevation values are rounded to three decimal places.
This is why the ESRI MFD flows differ so from my smootheed flows in these
Antarctic Dry Valleys figures.
back to the classic stability page
back to the main fuzziness page
back to the new stability page
on which Harvey implements the Montgomery/Dietrich fuzzy flowaccumulation algorithm in python
within the SHALSTAB slope stability calculator.

