Model Sensitivity
Download an interactive exercise to explore the
SHALSTAB model.
main muddled stability page
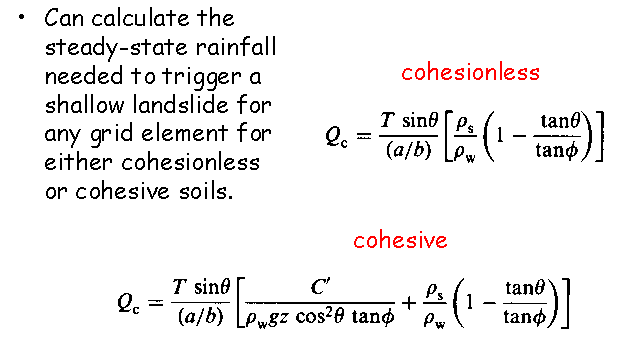
Let's see that as a graph.
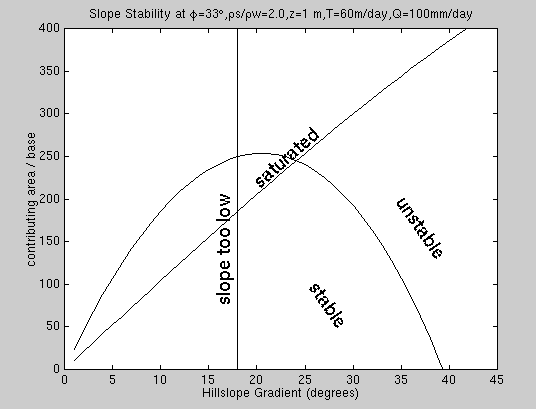
The parabola represents the equation above. Under the parabola, the
hillside is stable.
However, the hillside is also stable (barring positive pore pressure) if the
tangent of the slope is less than half the tangent of the friction angle (phi).
Furthermore, the addition of additional water makes no difference after
the entire soil column has been saturated.
Consider the class of landscape cells at 20°. As area/base rises
above 205 meters, overland flow begins. Any greater contributing area,
even at values above 250 meters, will have no effect on stability.
Let's look at what happens when we vary single parameters.
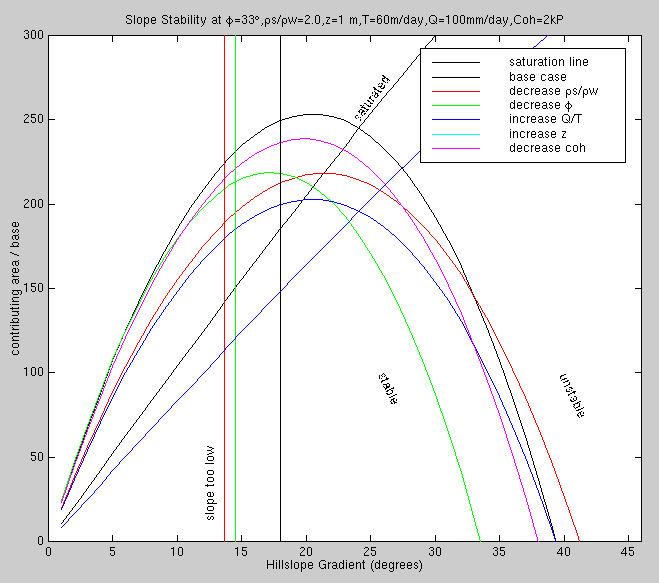
The black curve shows the base case of
typical parameters for a northwest clearcut slope with a heavy steady-state
rainfall of 4 inches per day.
The region above the black parabola and to the right is unstable.
The region above the nearly diagonal line is saturated;
increasing the contributing area merely causes increasing overland flow.
(Overland flow can eventually cut channels, but it not a cause of landslides.)
The region to the left of the point where the diagonal meets the parabola is
always stable; the ground saturates before the wetness can rise to the level to
cause instability.
The region to the left of the vertical line is always stable at any cohesion.
The green vertical line goes with the green parabola and the red lines and the
blue lines also go together.
The vertical black line corresponds to all the other cases.
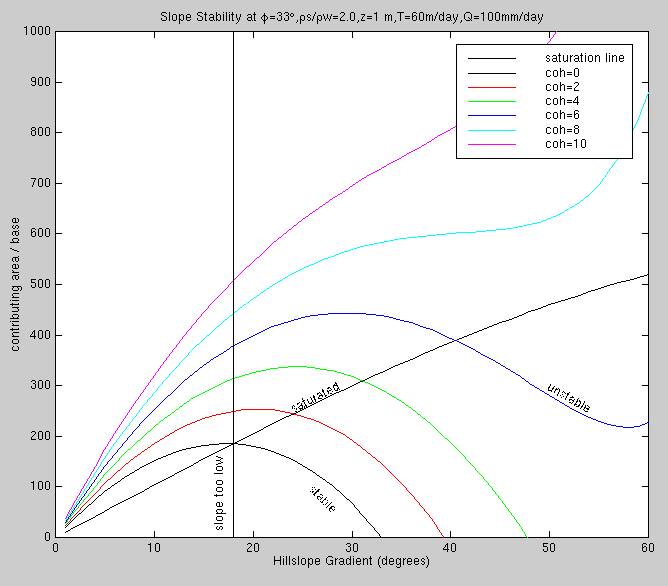
Holding other factors constant, we see the effects of
altering the cohesion. A cohesion greater than 7 kPascals will be stable in any
topography. At some cohesion values, the model predicts greater stability at higher
slopes.
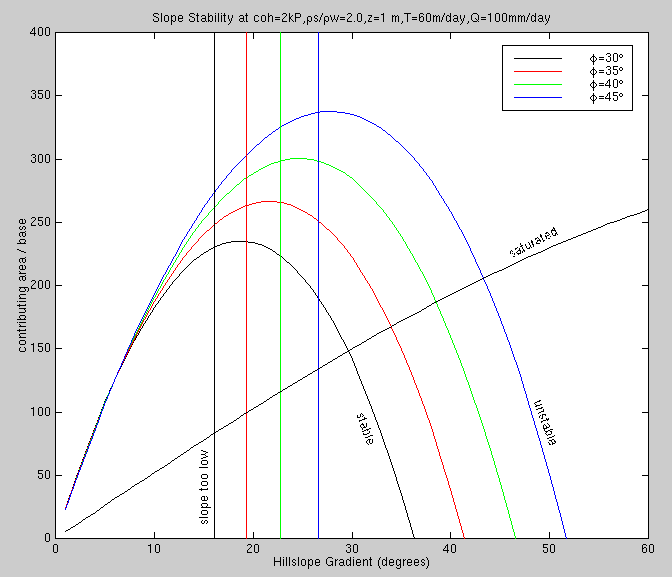
Holding other factors constant, we see the effects of
altering the friction angle. As in previous graphs, the vertical lines are
irrelevant, because they lie to the left of the intersection of the saturation
line with the parabola.
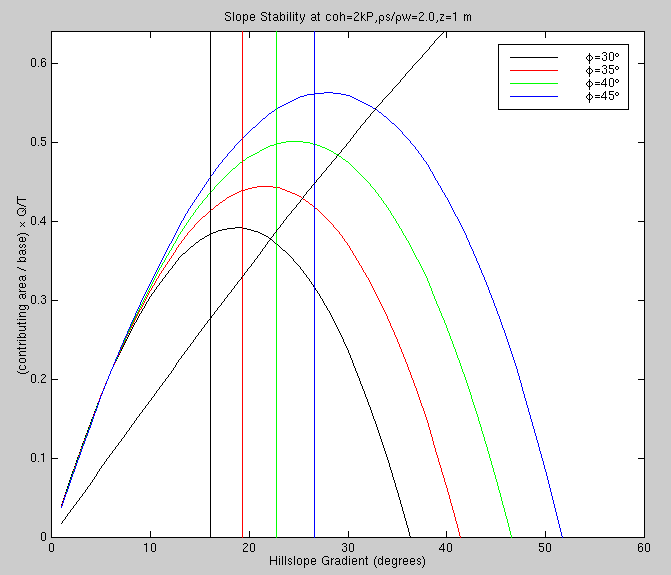
Everything in the previous graph was proportional to T/Q, so we can pull it out
by multiplying by Q/T.
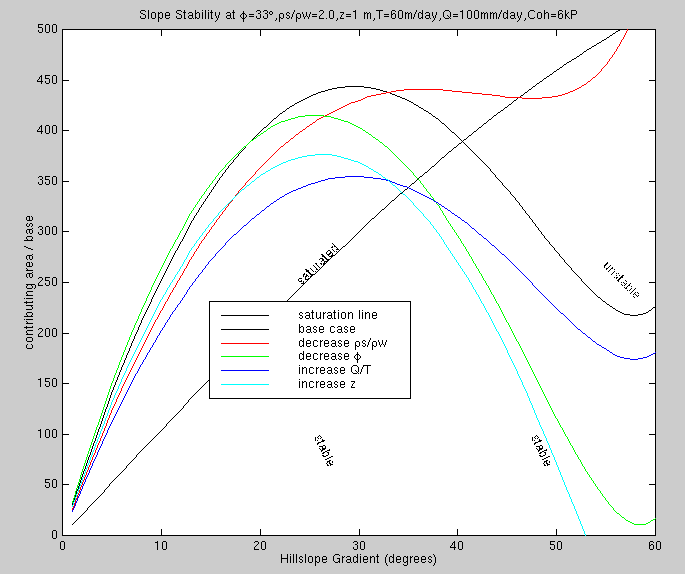
Look at another version of the first graph, but with a base case cohesion of 6.
The slope in nearly totally stable (cohesion of 7 is always stable), but the contribution
of cohesion is inversely proportional to soil depth. Thus doubling the soil depth
cancels out the increased stability resulting from doubling the cohesion.
Direct questions to Harvey Greenberg and
Dave Montgomery
Main Geomorphic Research Group Page


