Aral Basin Hydrology

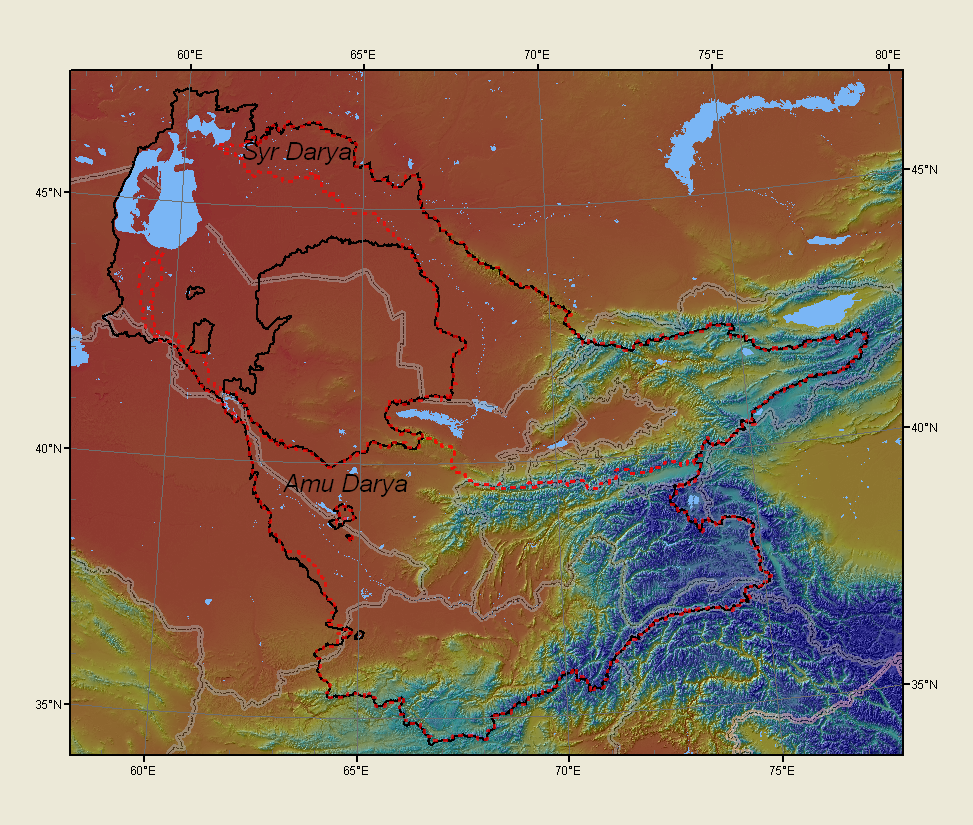
This is a chunk of the Hydrosheds conditioned 3" DEM which we built on y:\topog\world\hydrosheds\hydrosheds.gdb. The black basin boundary comprises two basins in the beta 15-second HydroSHEDS database. Blue water polygons are from the SWBD. The red dashed lines show the two major basins as defined for our initial VIC modeling. Note one large undrained basin and four smaller ones.

Six nations drain into the Aral Sea:
NationArea (square km, using the HydroSHEDS basin polygons)
Kazakhstan 221163
Uzbekistan 249748
Turkmenistan 57262
Kyrgyzstan 118403
Tajikistan 136862
Afghanistan 167031

2016 work

The first step for to prepare for the VIC model is to define the basins. A good starting point for most of the world (up to 60N) is the HydroSHEDS conditioned DEM. It is based on the SRTM 3-second (~90m) DEM of the world. Mapped rivers and basins were used to insure that there are no spurious sinks. Spurious sinks plague most DEMs, and they must be dealt with before processing can continue. This is usually done by "filling" sinks, but the results can diverge sharply from reality. The HydroSHEDS data, though it has long been in a beta state, is a valuable resource.

DEM

After tiles are mosaicked, it is necssary to generate (or download and mosaic) rasters for flowdirection and flow accumulation. Observing maps and recent imagery, we selected pour points. The Aral Sea is now two distinct basins, and each is essentially the basin of one river. The cells with high values in the flowaccumulation grid are essentially modeled rivers, and we made certain the the mouths of the Syr Darya and Amu Darya lay on modeled rivers.

The "watershed" command generates two modeled basins at 3-second resolution. The flowdirection raster was masked to those basins. Then a custom python script ( flowscale.py on http://gis.ess.washington.edu/projects/scaling ) was used to generalize this to a raster of .125 degree (450 second) cellsize. The web page shows how the resulting flowdirection raster can be examined and hand-edited if desired.

The aggregate command counts the number of 3-second cells per .125-degree cell. Dividing by 22500, we get the "fraction file", indicating the portion of each VIC cell occupied by the watershed. Most values are 1.0 or 0.0. The fraction file can be used as a weight in calculating the cumulative upstream area in cells.

VEGETATION

MODIS landcover is a good worldwide source for landcover, but we used the Klein et al landcover for most (Afghanistan was not covered.) of our study area. MODIS data came in the files:
MCD12Q1.A2013001.h21v04.051.2014308191630.hdf
MCD12Q1.A2013001.h22v04.051.2014308191823.hdf
MCD12Q1.A2013001.h22v05.051.2014308191831.hdf
MCD12Q1.A2013001.h23v04.051.2014308192016.hdf
MCD12Q1.A2013001.h23v05.051.2014308192023.hdf
MCD12Q1.A2013001.h24v05.051.2014308192152.hdf
covering the year 2012. It was in a sinusoidal projection on a spherical ellipsoid. Data was first projected onto cells on a WGS84 spheroid at an oversampled .00416667-degree cell size. A majority filter was used to derive values of landcover classes for .125-degree cells. Overlapping areas were compared, and a mapping of MODIS categories to Klein categories was devised. MODIS data was used for Afghanistan and a few stray edge cells where there was no data in the Klein, etal map. Landcover parameters were obtained from a combination of previously calibrated VIC parameters and University of Maryland vegetation parameters.

SOIL

Soil data was obtained from the ISRIC World Soil Database M_02_apr_2014 files. The obtained data was percentage of sand, clay and cell for three soil layers (10cm, 50cm and 100cm) and bulk density. We then used the FAO soil comparison to convert percentages to soil classes and soil parameters were obtained from a combination of previously calibrated VIC parameters and the FAO soil database.

STATIONS

Stations were obtained from local sources. Locations were checked and adjusted from maps in GIS. Points were further adjusted to lie on the appropriate calculated rivers, based on the 3-second DEM, and contributing areas were calculated. We would have liked to compare these areas with a table of catchment areas, but such information was not available in our study area. Our basin areas were compared to the areas as calculated on VIC cells, and the the VIC row and column numbers were adjusted by up to one cellwidth to give the best representation of the catchment. As the Syr Darya and Amu Darya are modeled separately, these operations were done for each river basin.