Little Mountain Slope Stability Modeling
This is a quick slope stability modeling analysis of the slopes of Little
Mountain near Stillman Creek in Lewis County. Imagery is the one-meter NAIP
orthophoto series from the summer of 2006. The 10-meter DEM is a USGS product
derived from the USGS 1:24,000-scale topo sheets. The 3-foot DEM is from
a survey flown last winter by the Puget Sound Lidar Consortium. It is the
first of the Consortium data to be flown at 8 pulses/meter and gridded at this
resolution.
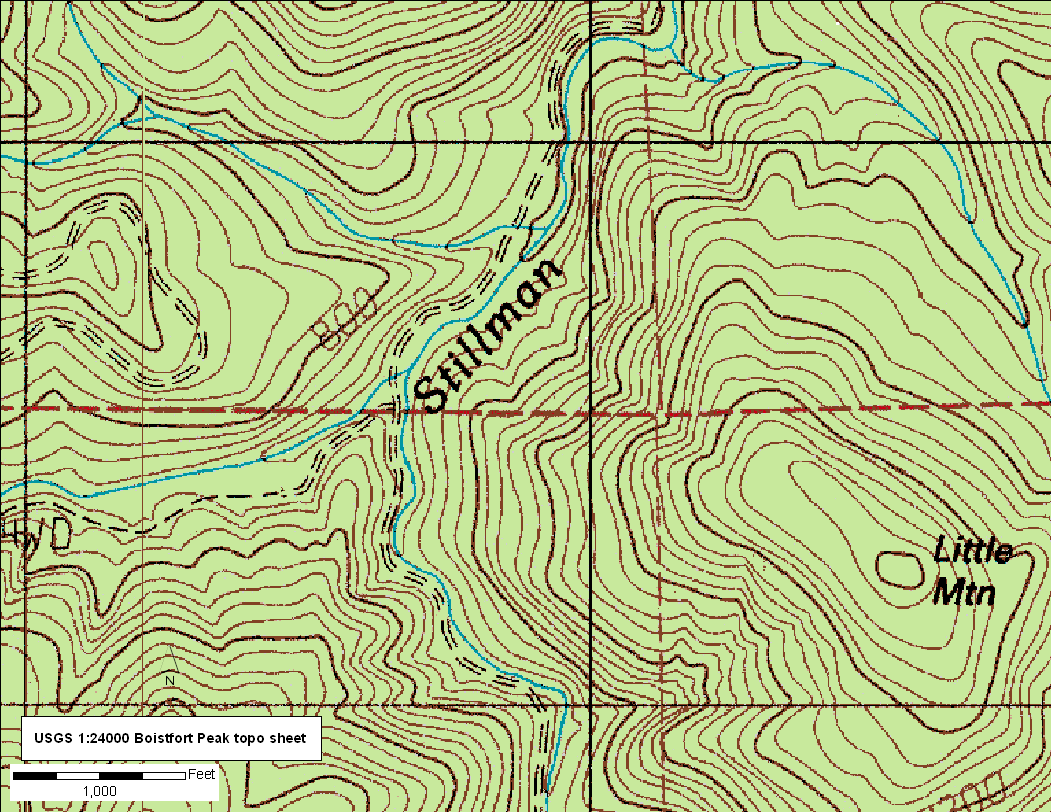
detail of USGS Boistfort Peak quadrangle
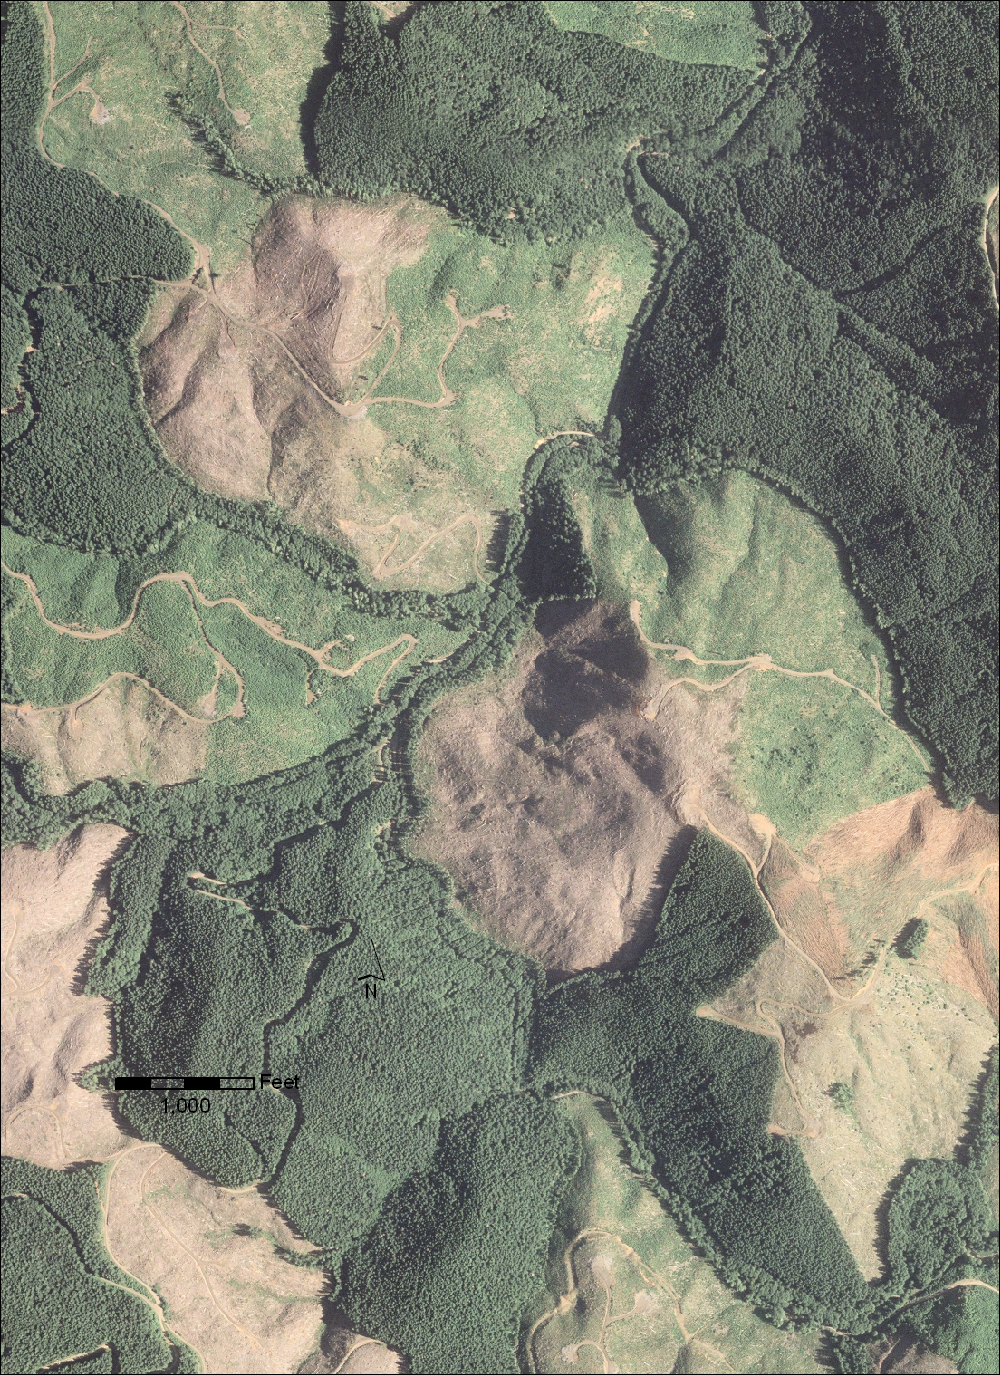
Orthophoto from 2006
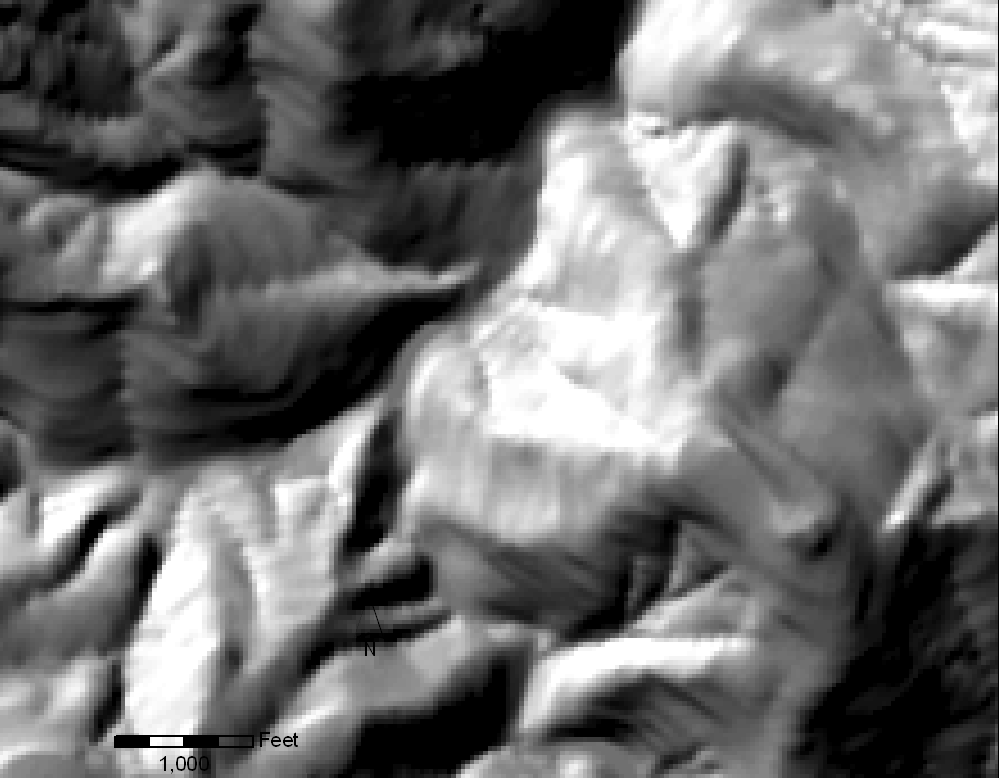
10-meter DEM
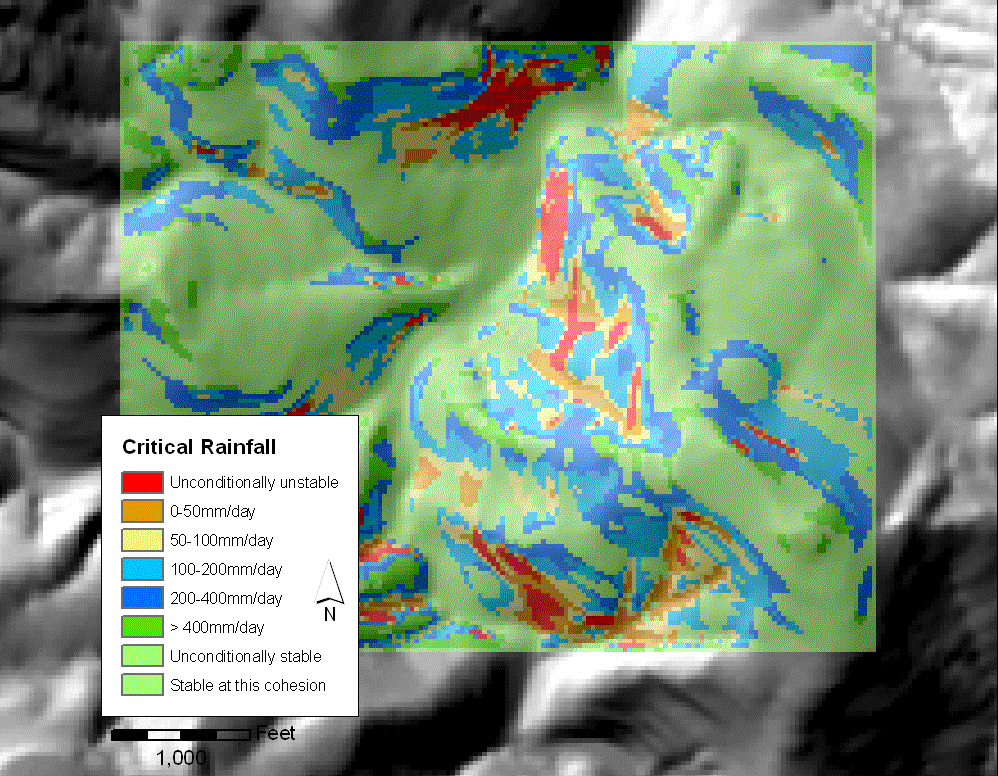
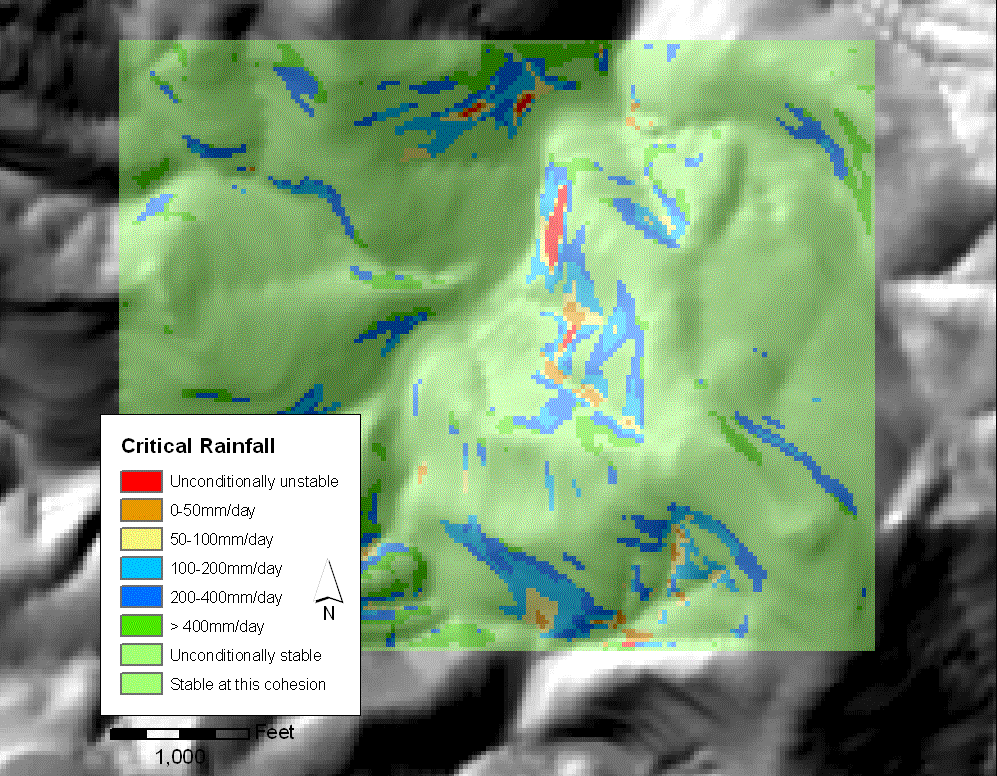
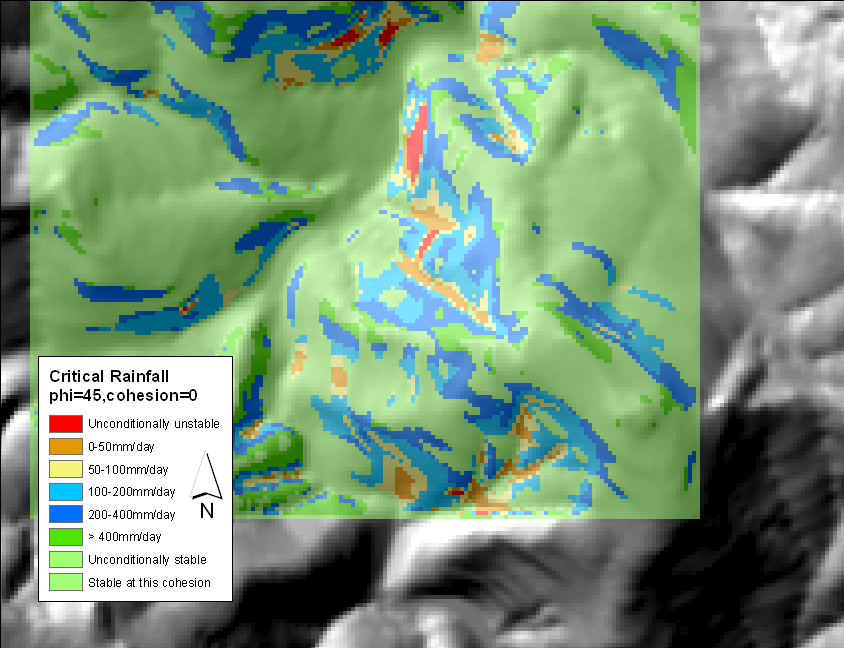
Critical rainfall: SHALSTAB stability model run on 10-meter DEM,
cohesion = 2 kP
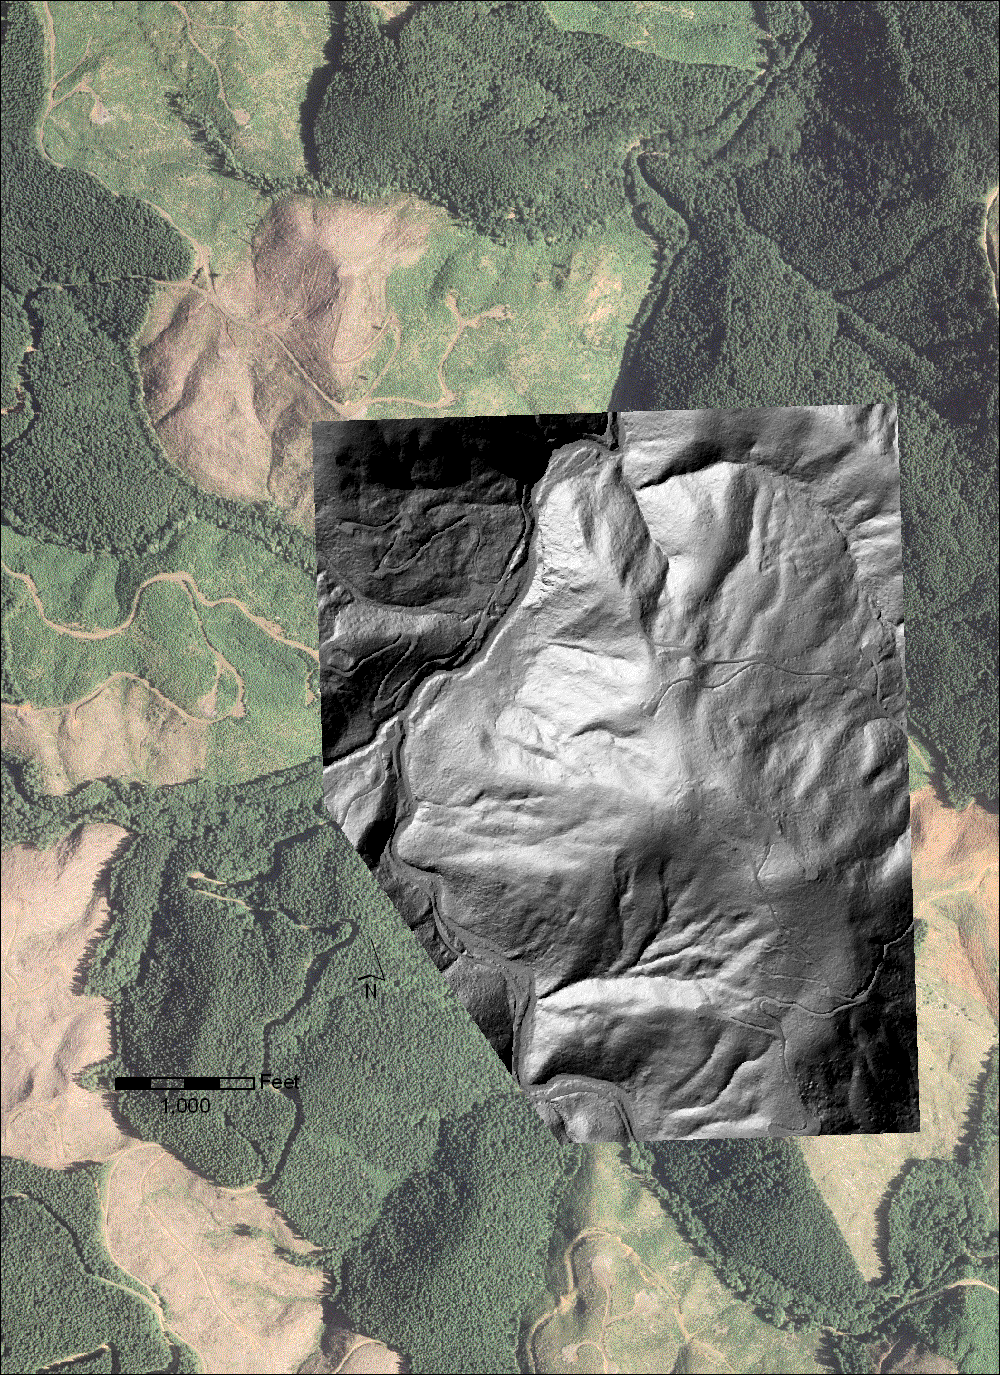
LiDAR DEM
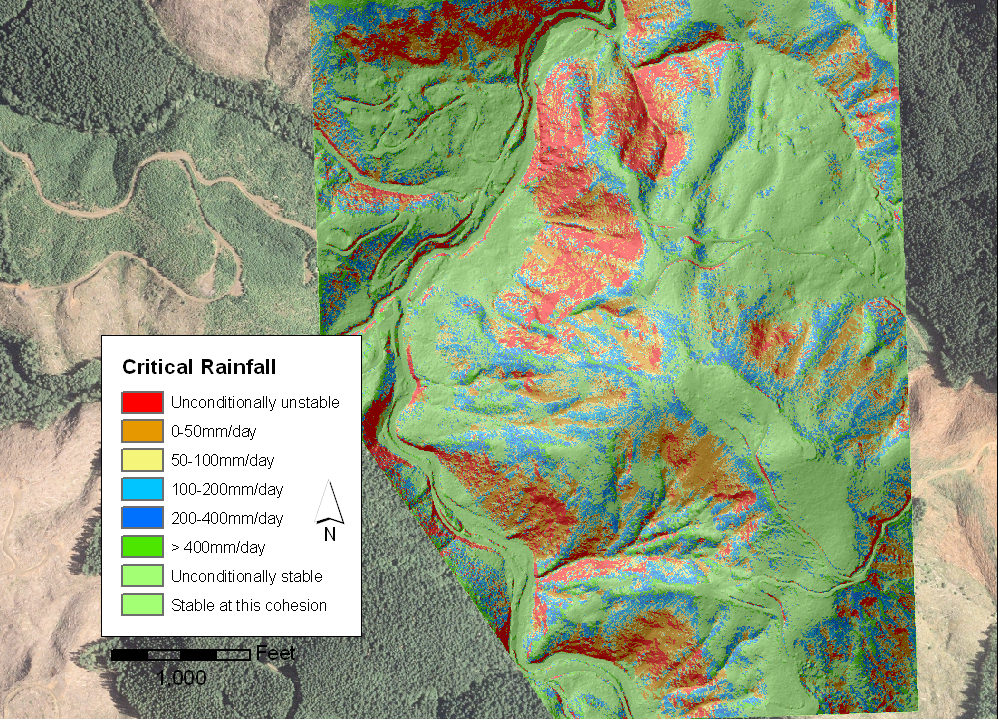
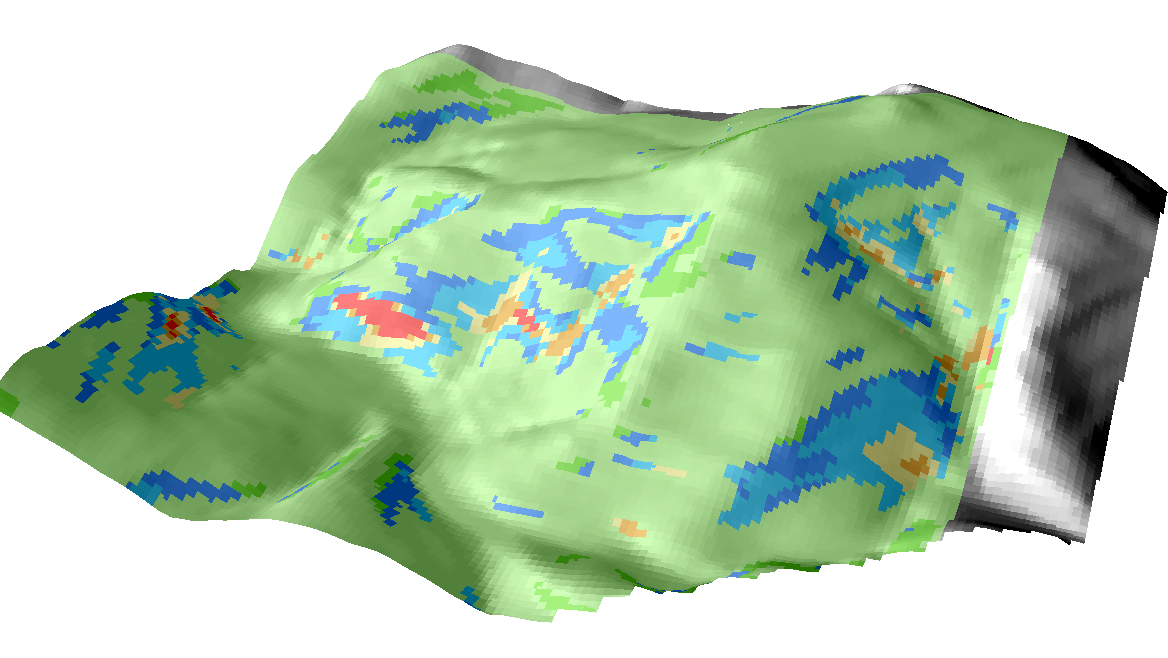
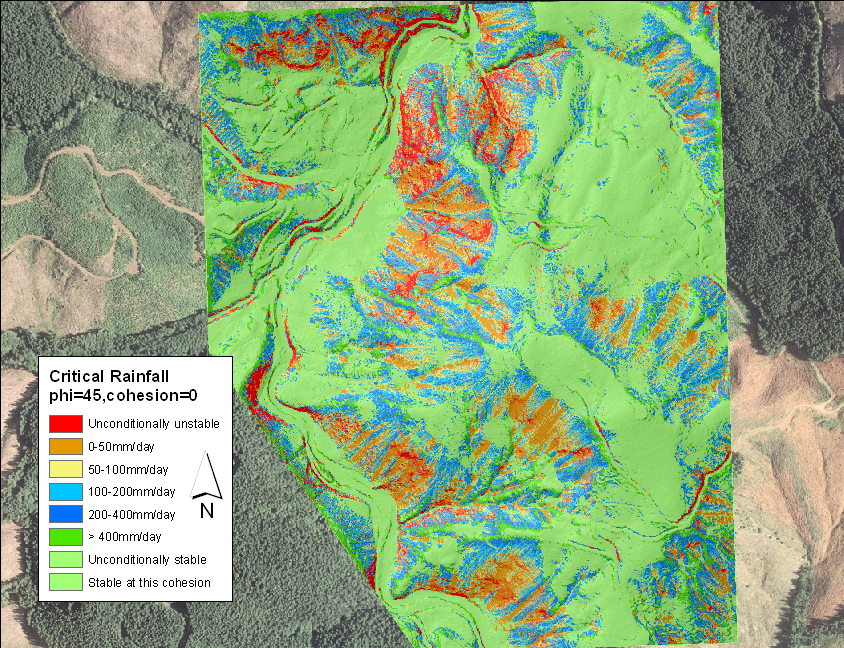
Critical rainfall: SHALSTAB stability model run on LiDAR DEM,
cohesion = 2 kP
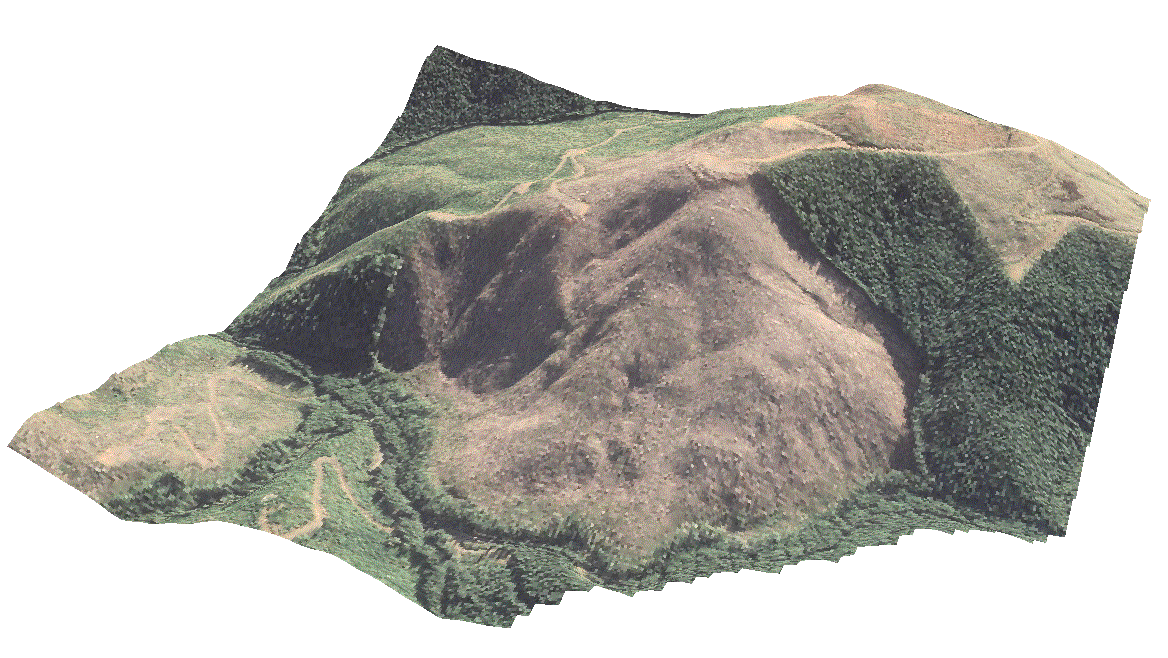
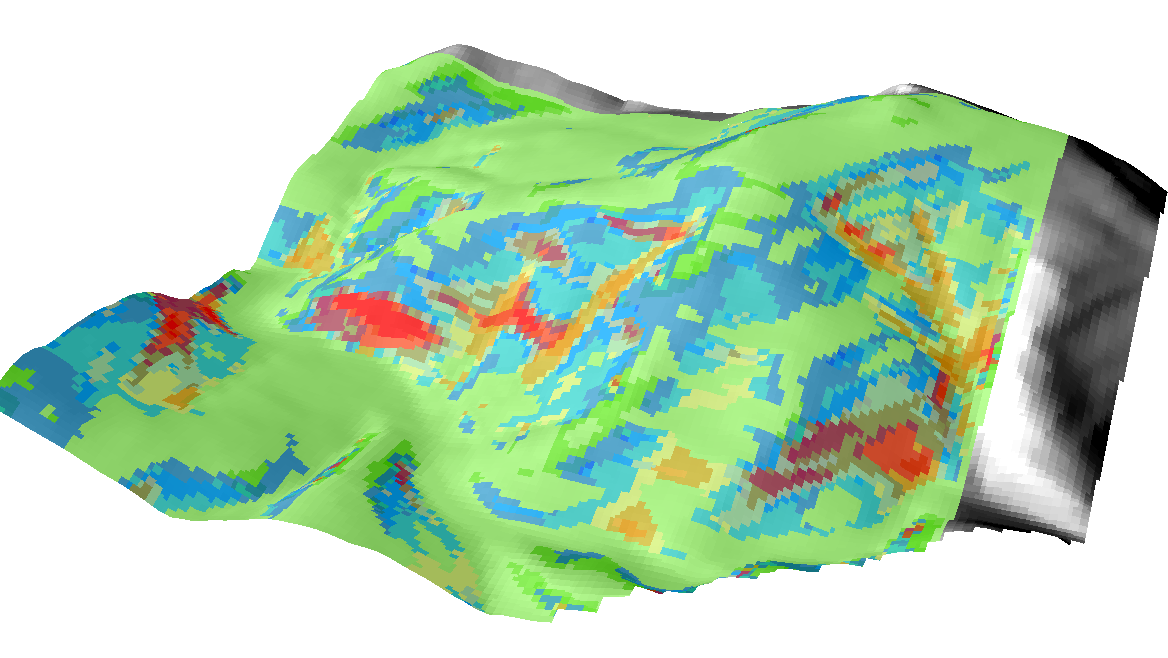
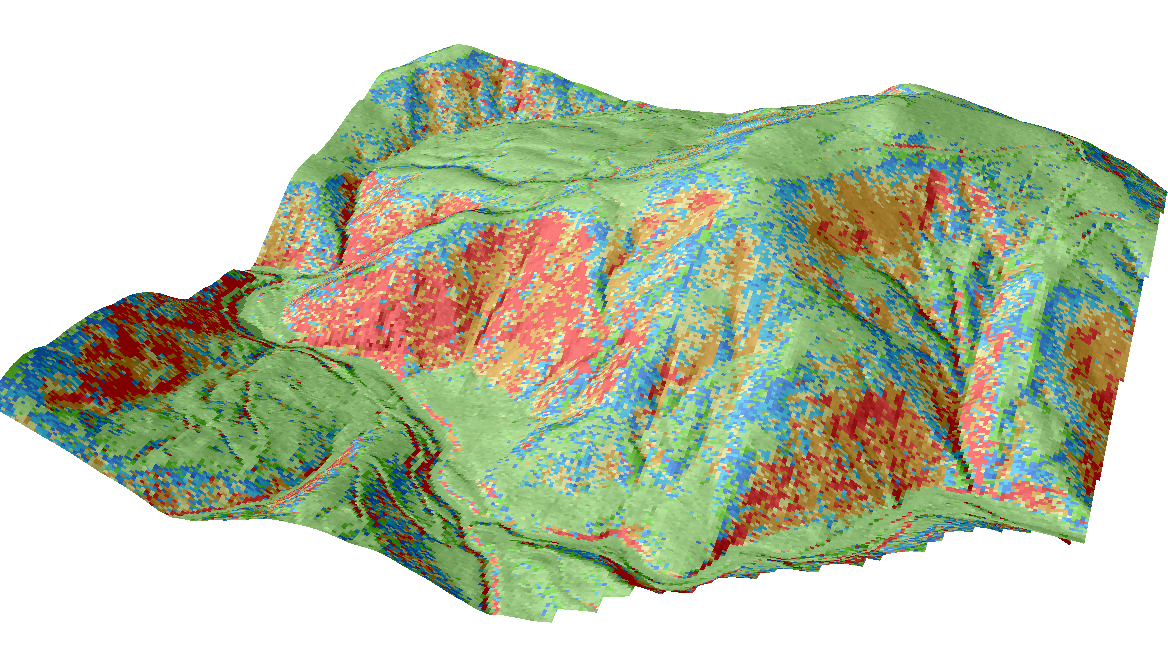
Following are perspective renderings of the photo and the two stability models:
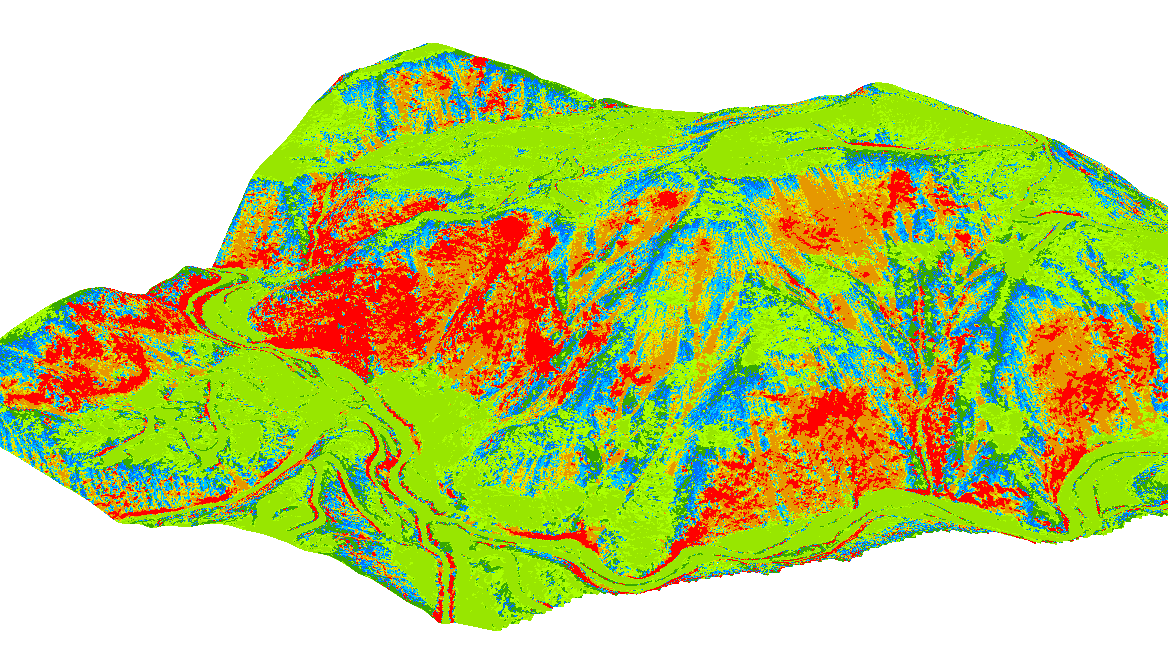
and here are model results with cohesion of 4 kiloPascals,
a value closer to the strength before clearcutting.

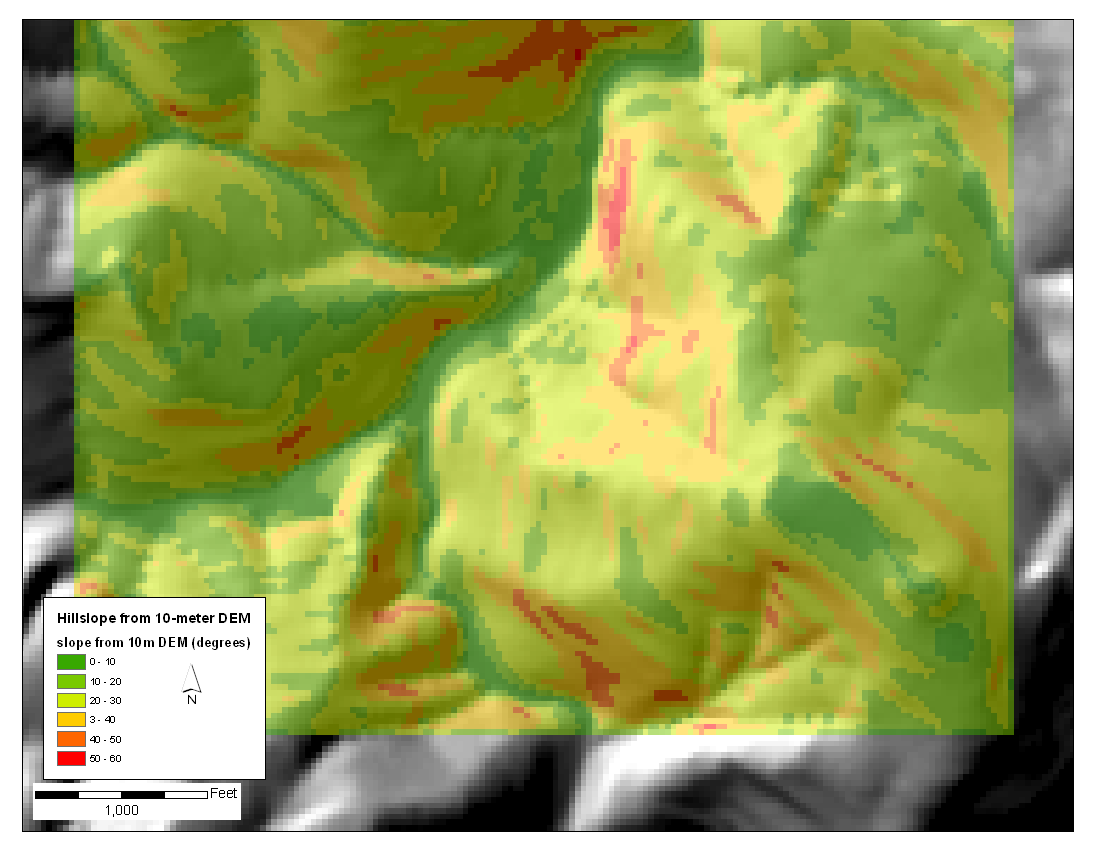
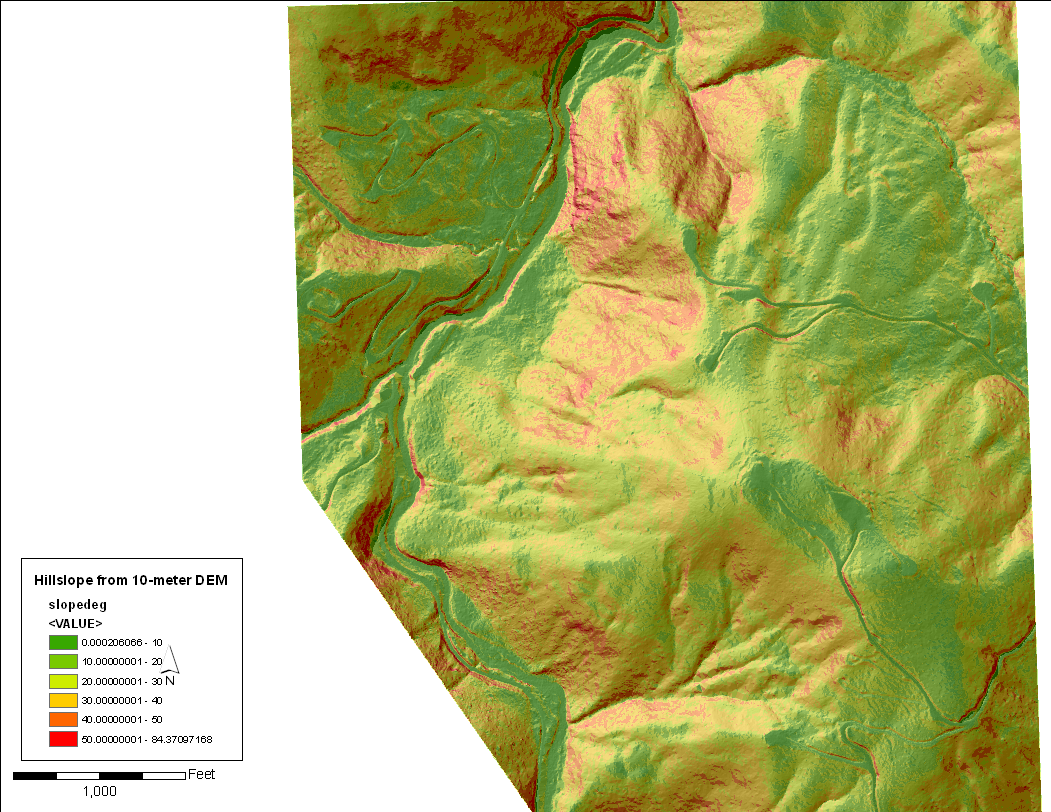
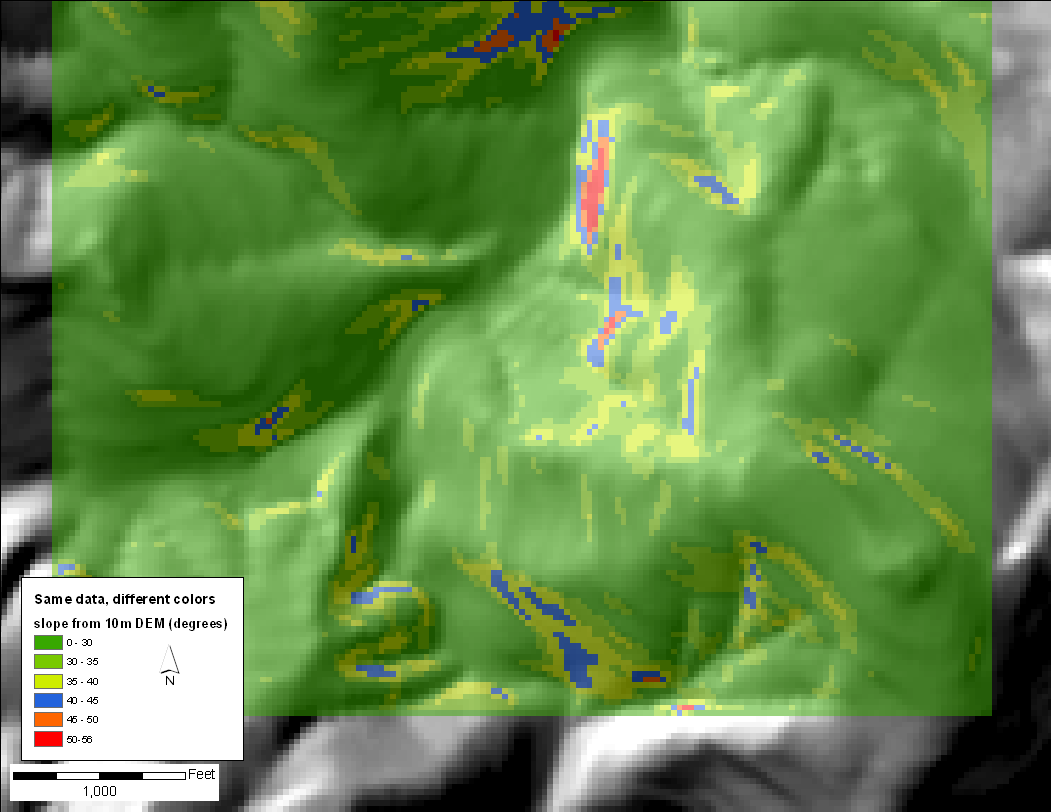
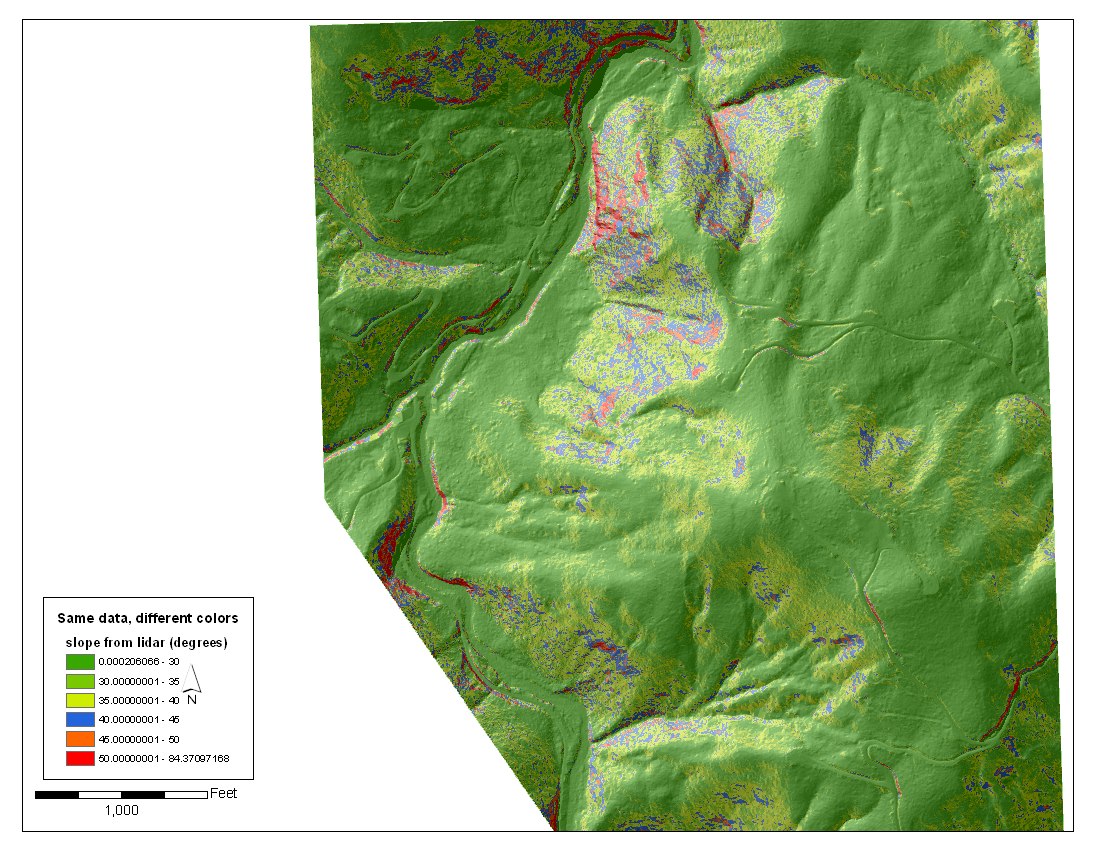
Following are slope maps, created with 2 different sets of class breaks.
Following are results of the simple version of SHALSTAB, using no cohesion, but increasing the friction angle to compensate.
And here is new information, that Harvey got around to assembling
October 2011
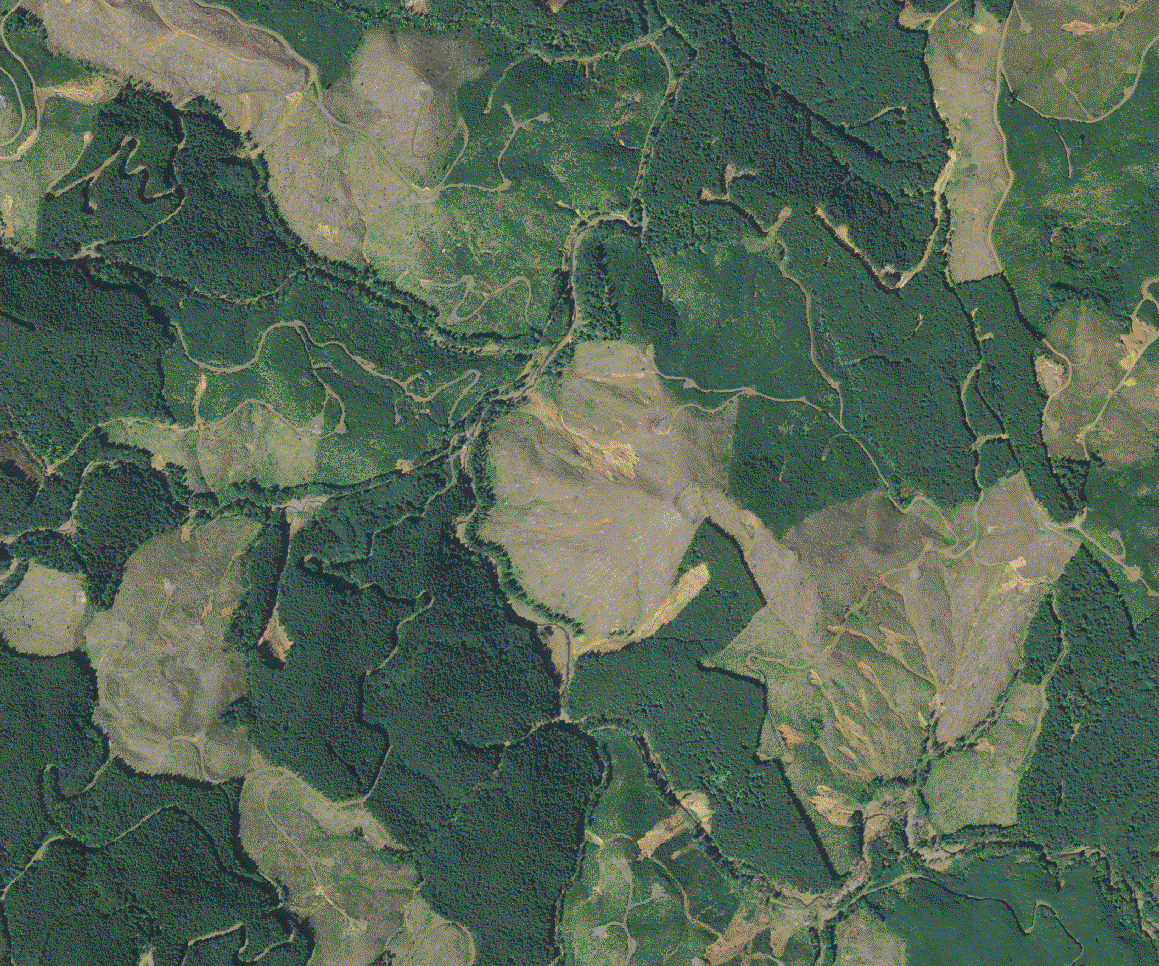
NAIP 2009 orthophoto. This is a four-band image with one-meter pixel size.
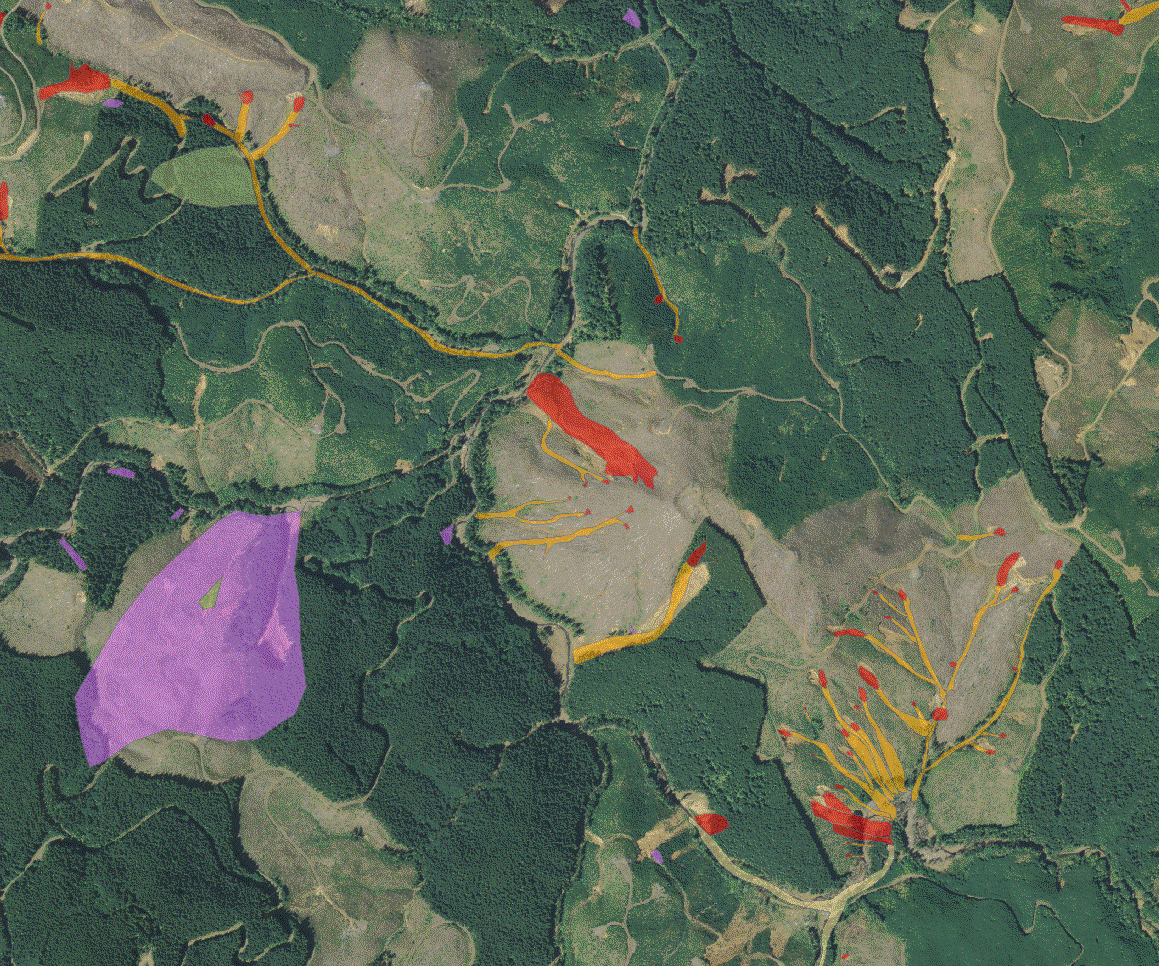
Landslides as mapped by DNR from the Seattle Times post-storm photo.
Last updated : 10/07/2011 23:58:47