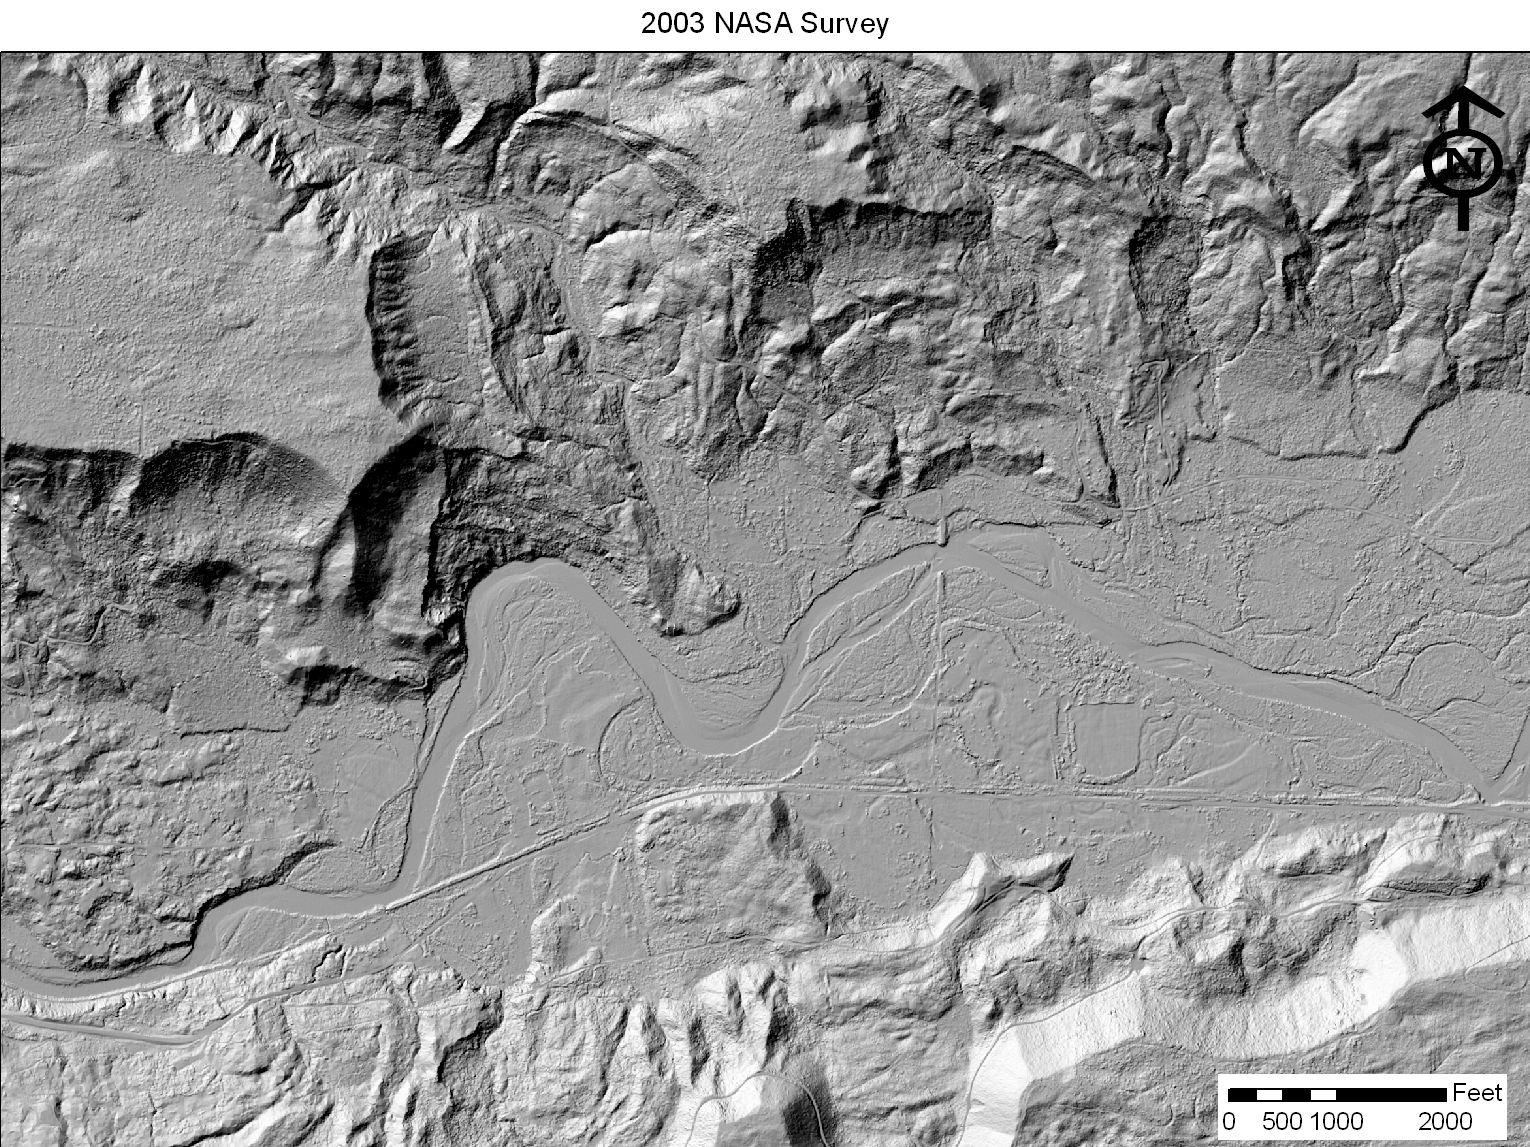
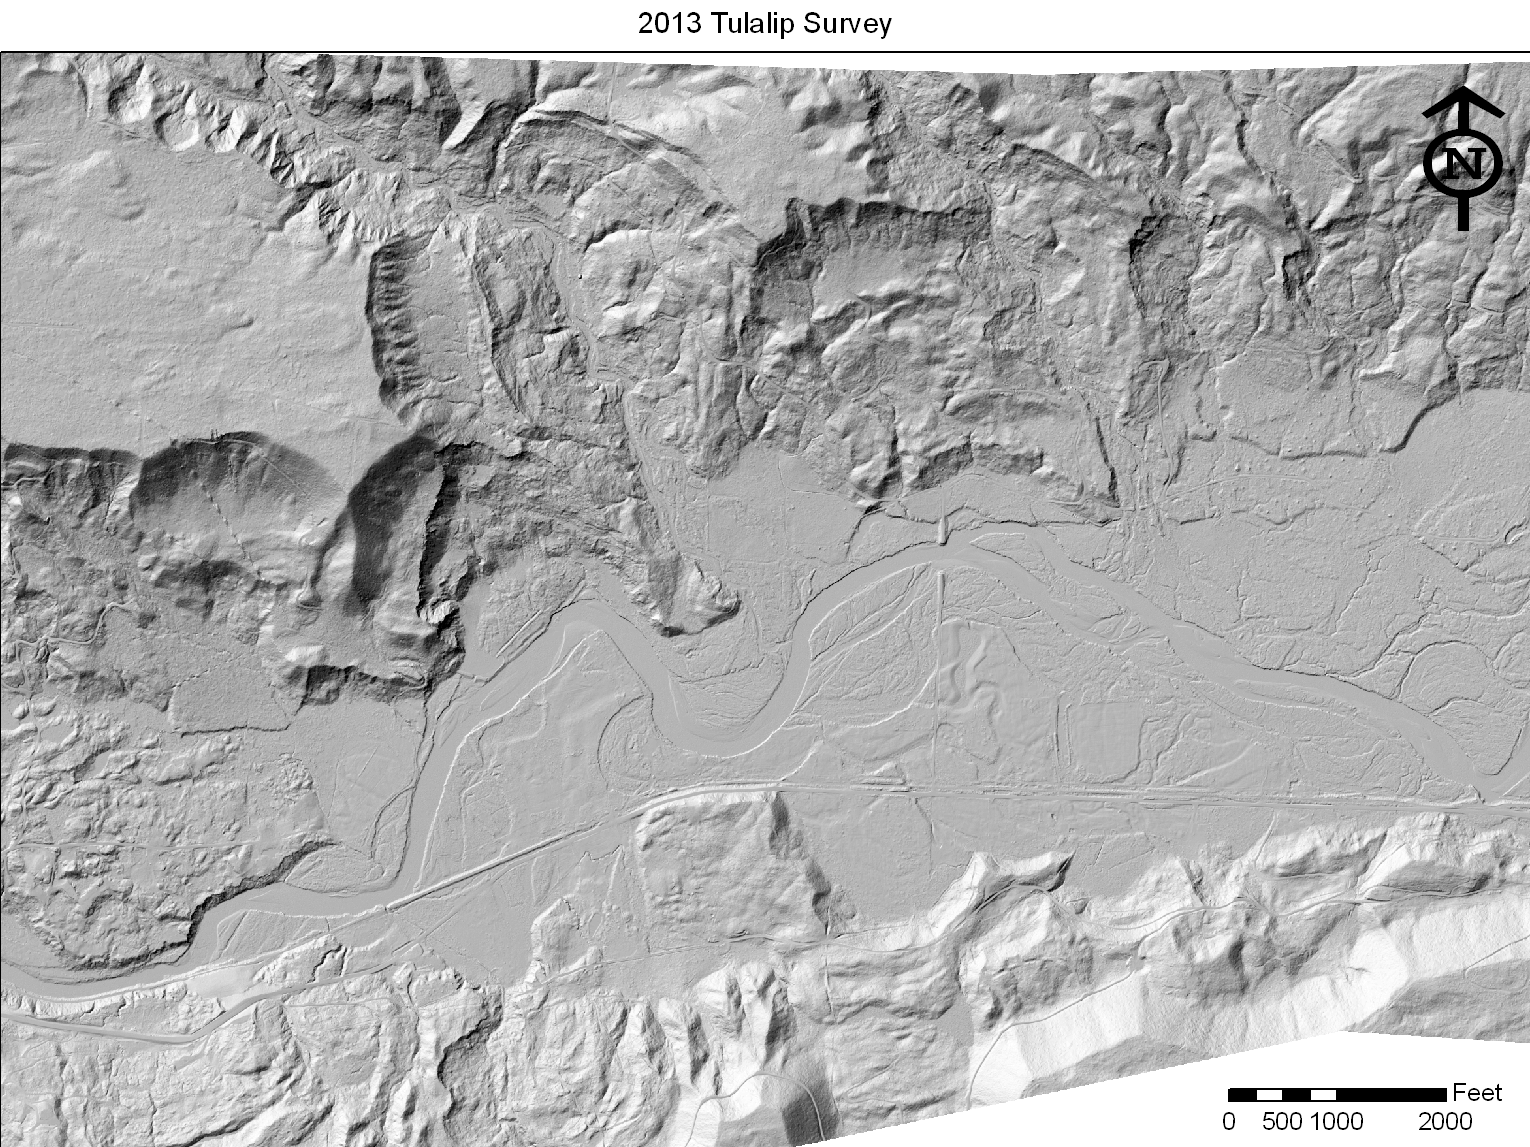
In addition to March, 2013 maps, here are more images.
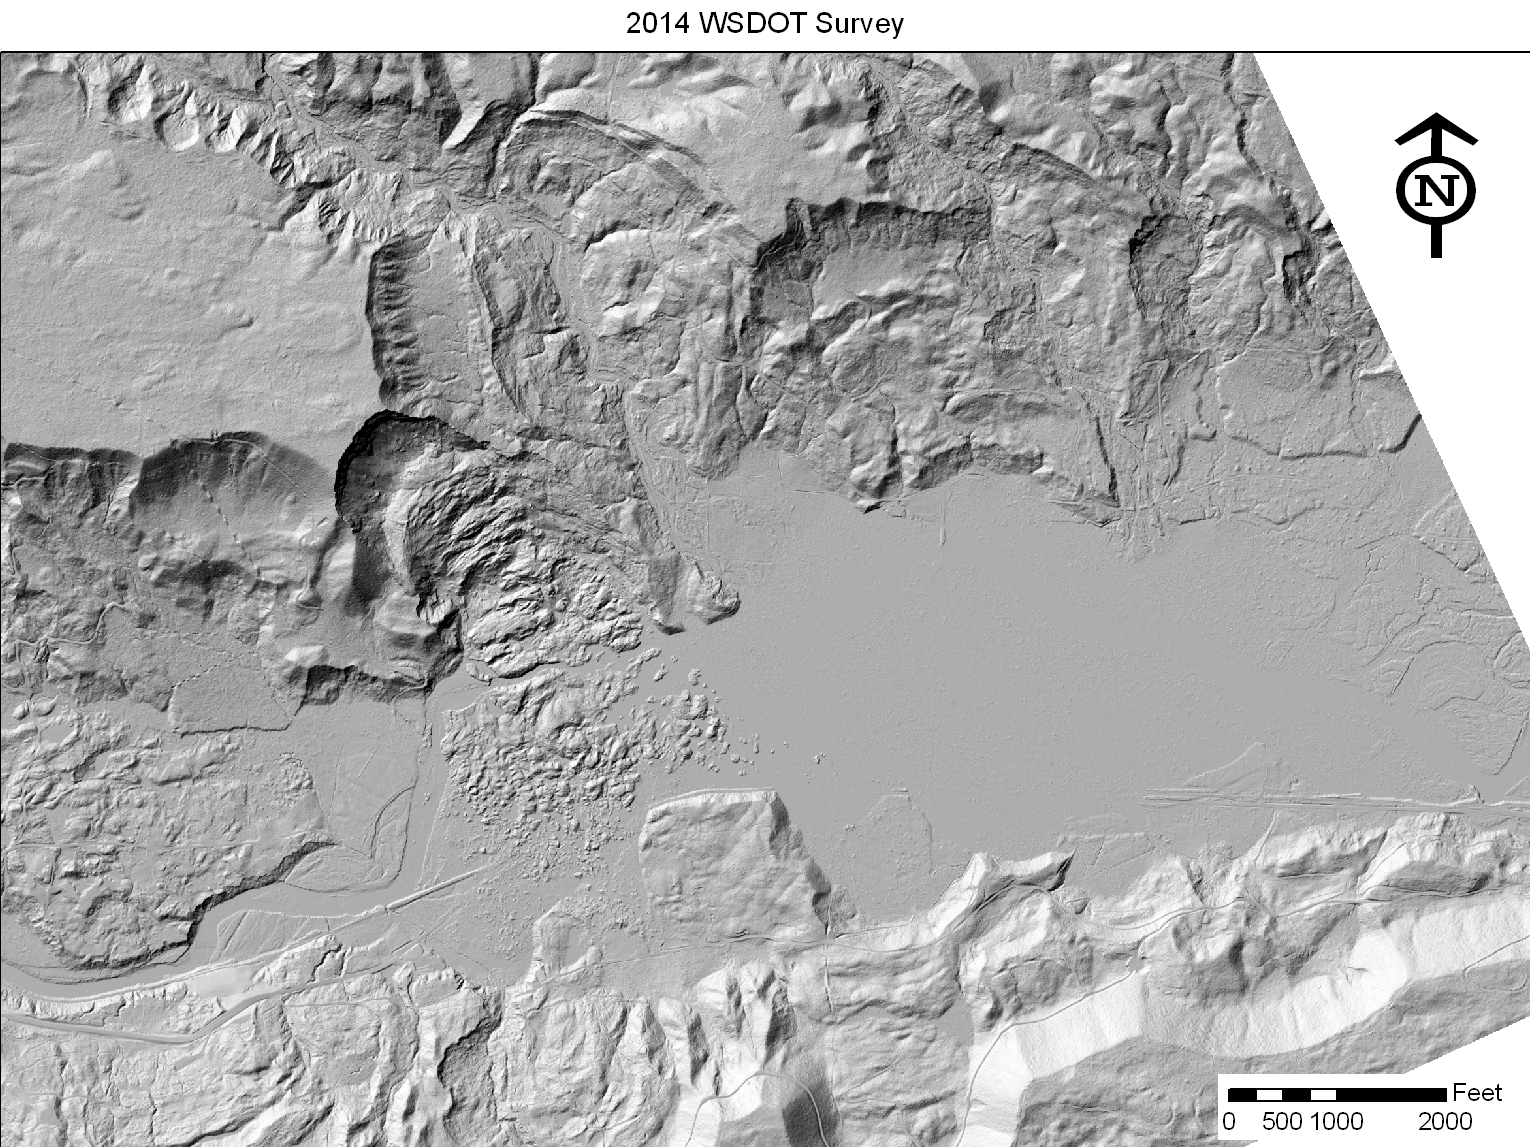
The third and fifth use provisional 2014 lidar data.
And here are hi-res maps incorporating bathymetry of the temporarily impounded area
And here are hi-res maps incorporating bathymetry of the temporarily impounded area
 (6-foot cell size)
 (3-foot cell size)
 (3-foot cell size)
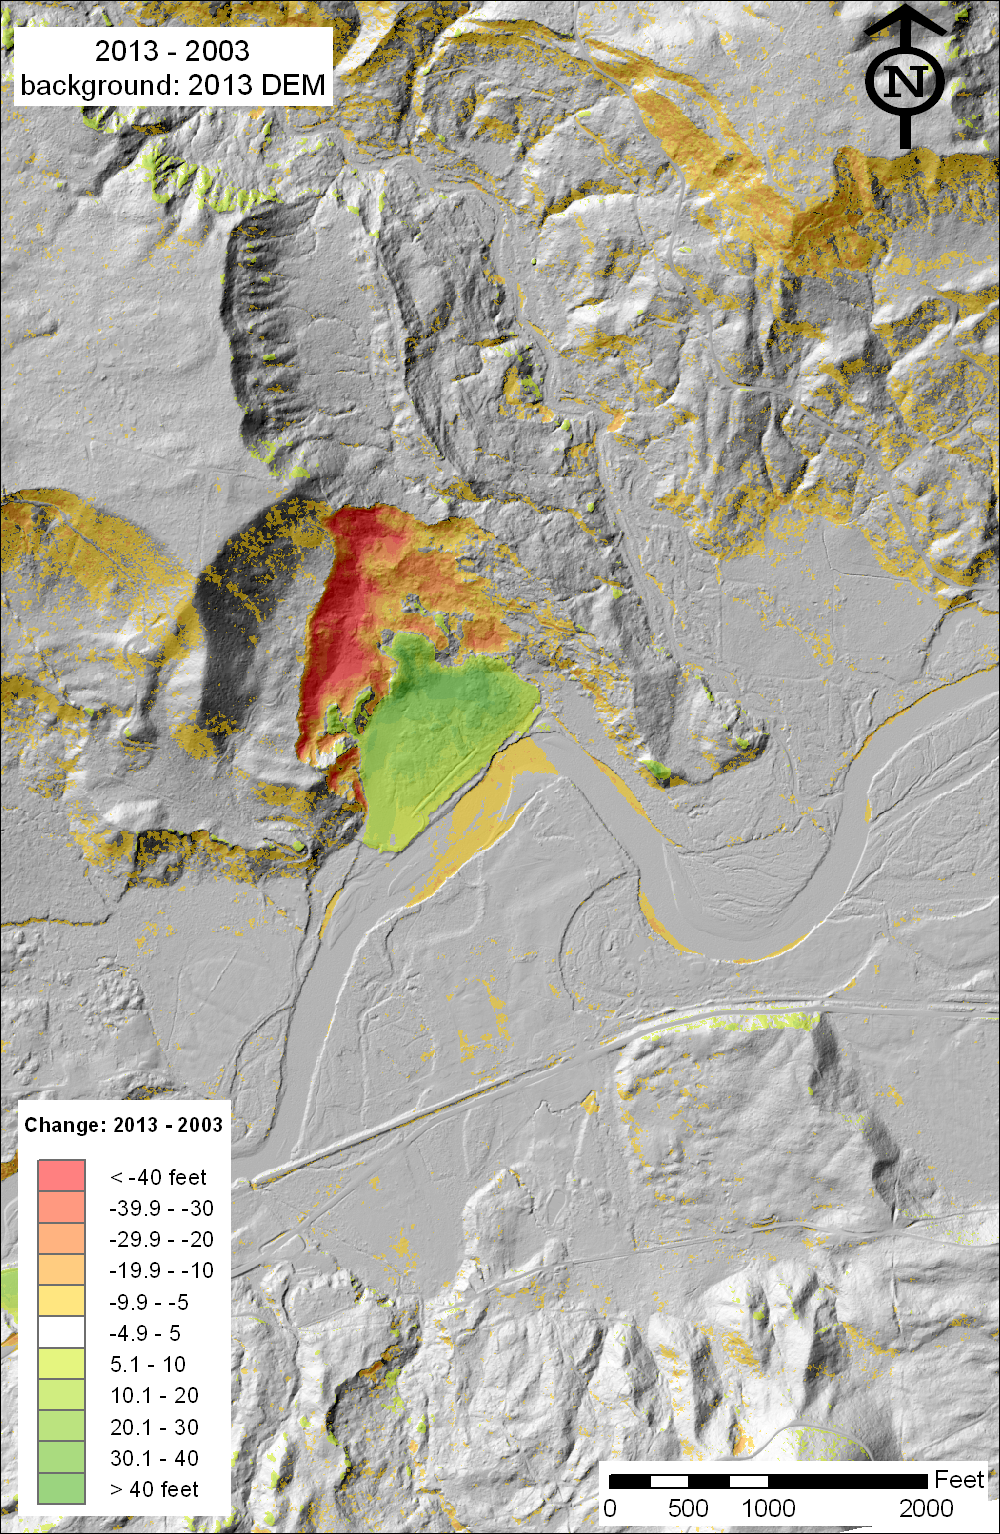
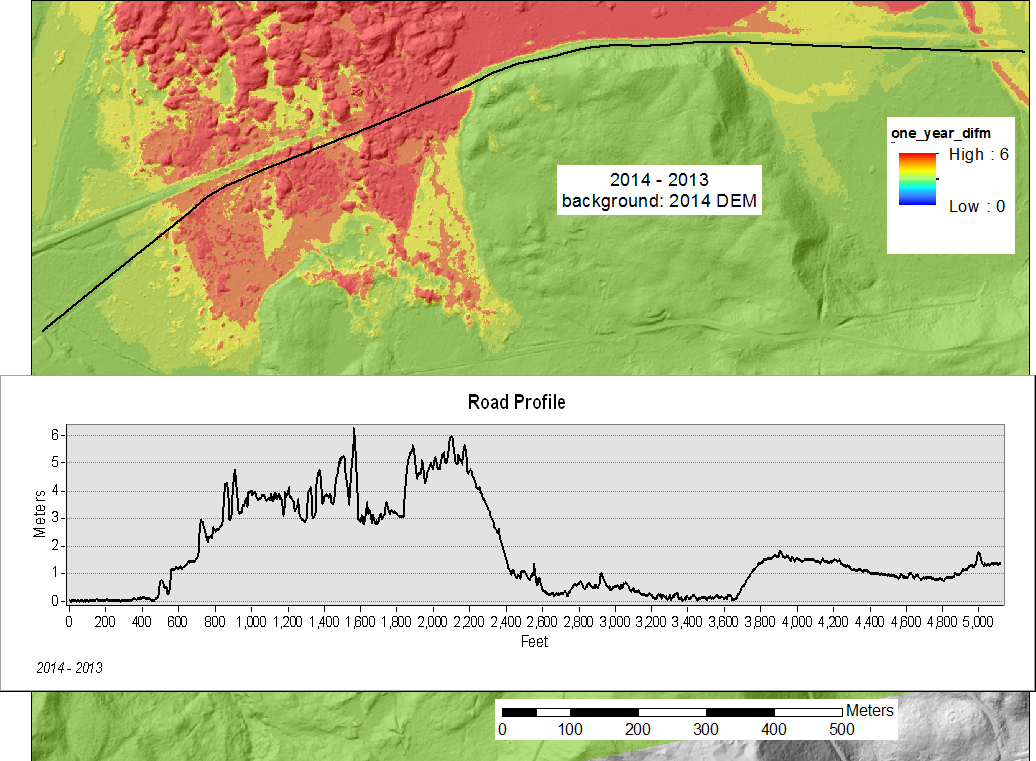
The key colors lost material in red to emphasize
that there is less butressing on the upper slope.
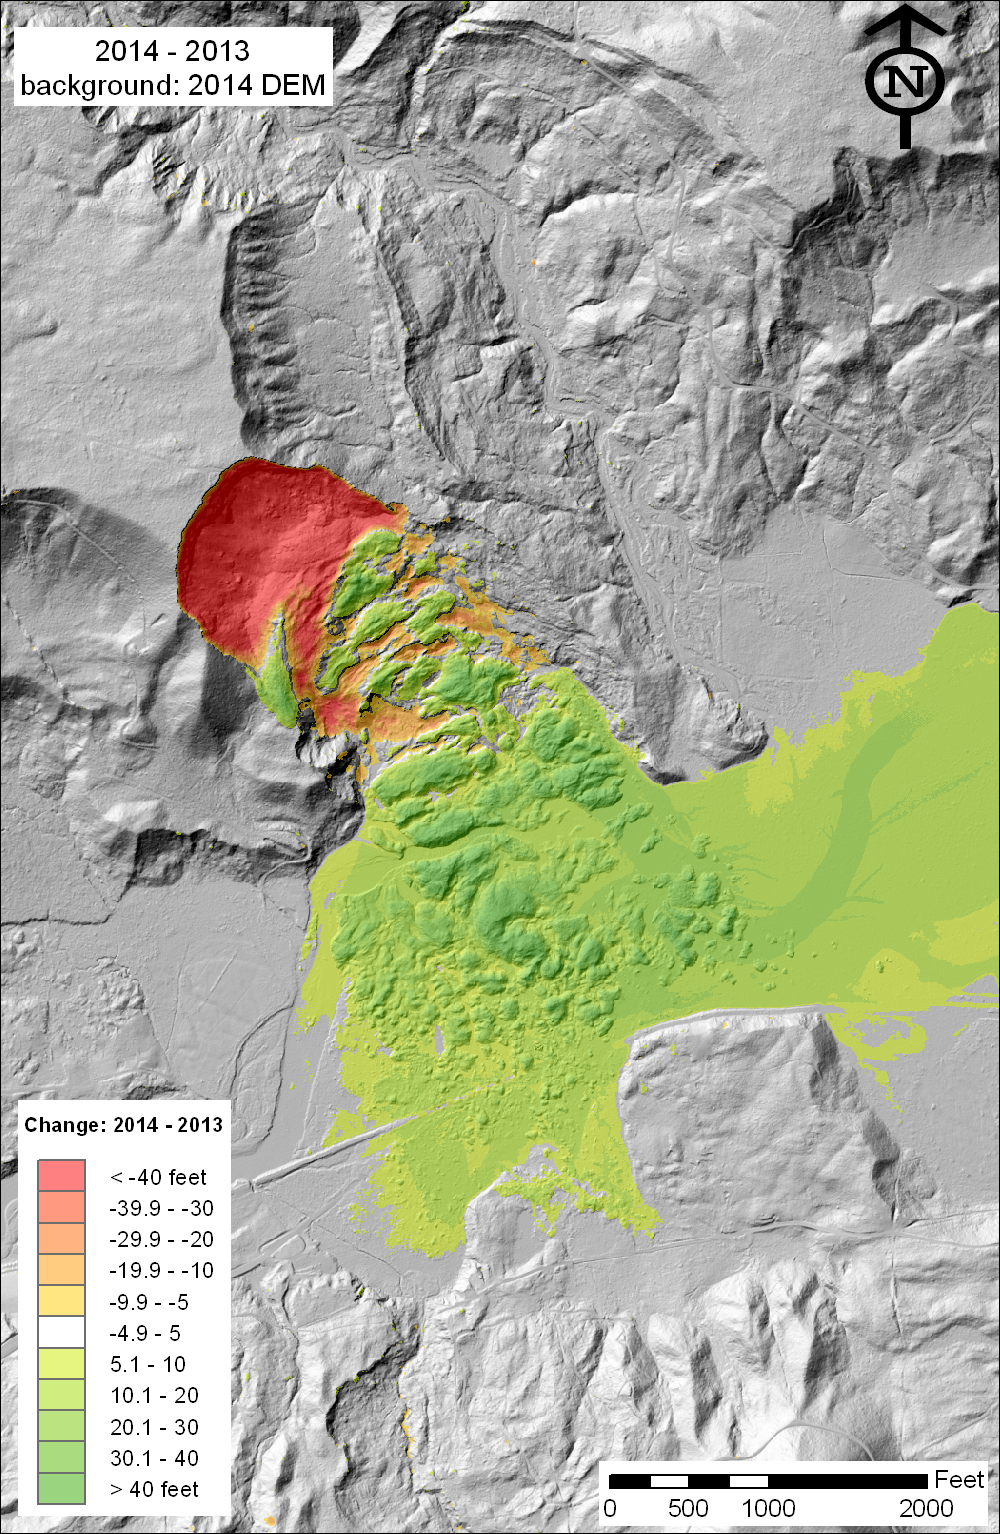
Images by Harvey Greenberg
Department of Earth & Space Sciences
University of Washington
Data from
Washington Department of Transportation
Tulalip Tribes (2013)
NASA (2003)
through the
Puget Sound LiDAR Consortium
April 8, 2014