Weather Data for SE Asia
Early work
A look at PR/TMI coverage
TMI wet spots
Data download cookbook
Thermal Microwave Rainfall
SRTM DEM
March 2002 bil files from TRMMM 2A12 data
Leaf Area Index
We have tried to get LAI V.04 data for the year 2000, but it does not
start until day 57, so we are building a dataset from March, 2000
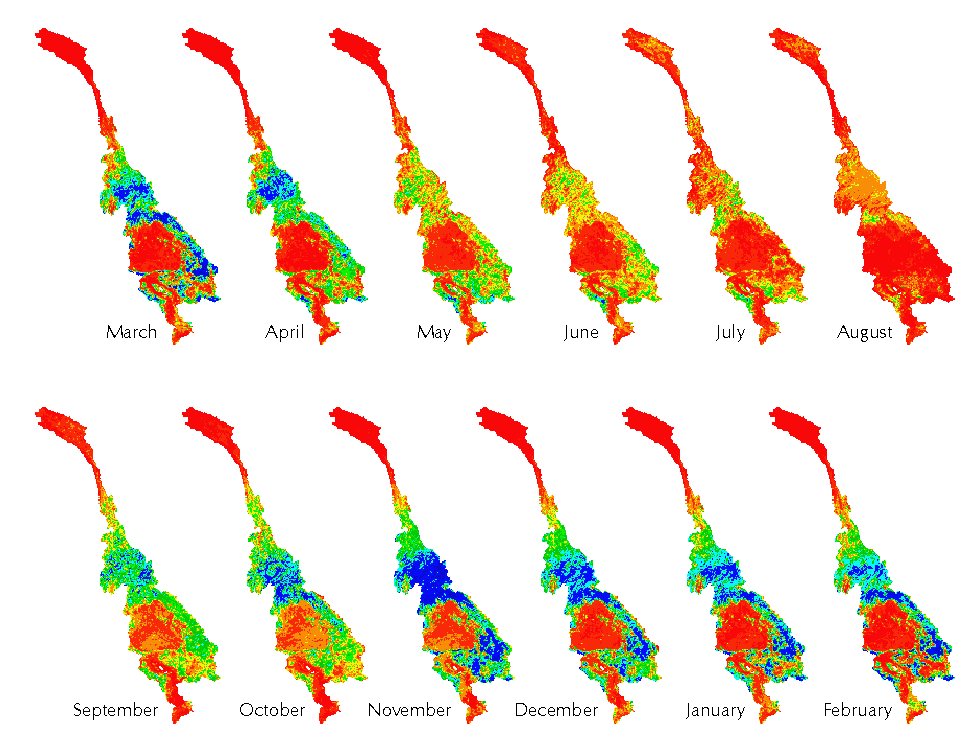
through February, 2001. Below are the results.
Thu Aug 19 15:33:59 PDT 2004: Problems with September and key scaling corrected.


We
- Downloaded the V004 tiles for one year. There were 35 tiles for each
8-day period, except that day 225 was missing.
- The LAI "band" was mosaicked and nearest-neighbor projected at 1/120-degree resolution.
This is approximately raw resolution. In the process, it was clipped to SE Asia.
- Geotiff files were imported to ARC/INFO
- Various no-data codes were converted to ARC/INFO's no-data
- Data was aggregated to 1/12-degree resolution.
- The 3 or 4 8-day time periods for each month were averaged. Those cells
(Thre were only 2 to 10 of them.) which were not represented by each time
period were filled in by the mean of available time periods.
Off the top of my head, I would say that the data looks disturbingly noisy.
This is also evident when I run a 45-frame animation of the year.
My first thought was that the problem could lie in aggregating 100 cells into one.
If clouds tend to cover leafy areas, the sample would be biased toward leafless
areas in partly cloudy periods. However, a quick look at a movie of
full-resolution data still shows trouble. See the time series below.
Mariza, here are the monthly grids in full 1/120 degree
resolution as ARC/INFO ASCII dumps. The first 7 lines are the internal
header. They unzip to 2 gigabytes of ASCII.

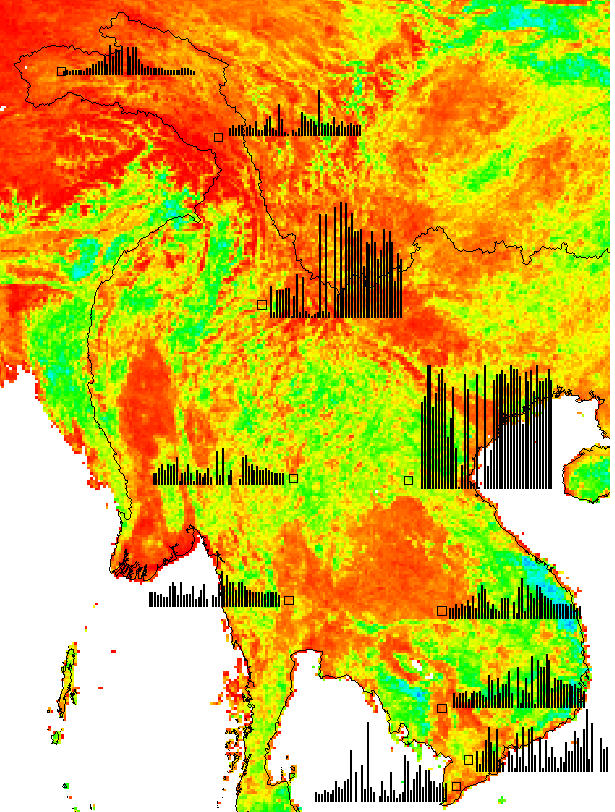
These are the LAI values for 45 8-day periods from March,2000 through
February, 2001. Ten points (indicated by squares) were randomly selected.
This is the fine-scale data; no spatial aggregation was done. The
background is aggregated June LAI, with the boundary of the SE Asia basins.
LAI values range from 0 to 68. I don't know if there is a multiplier.
The various no_data codes in the 8-day images were eliminated so that they
could be average
Any cell with one of the various no-data codes appears as no-data in the
monthly maps. It would take all night to fill in gaps as I did for the
aggregated data.

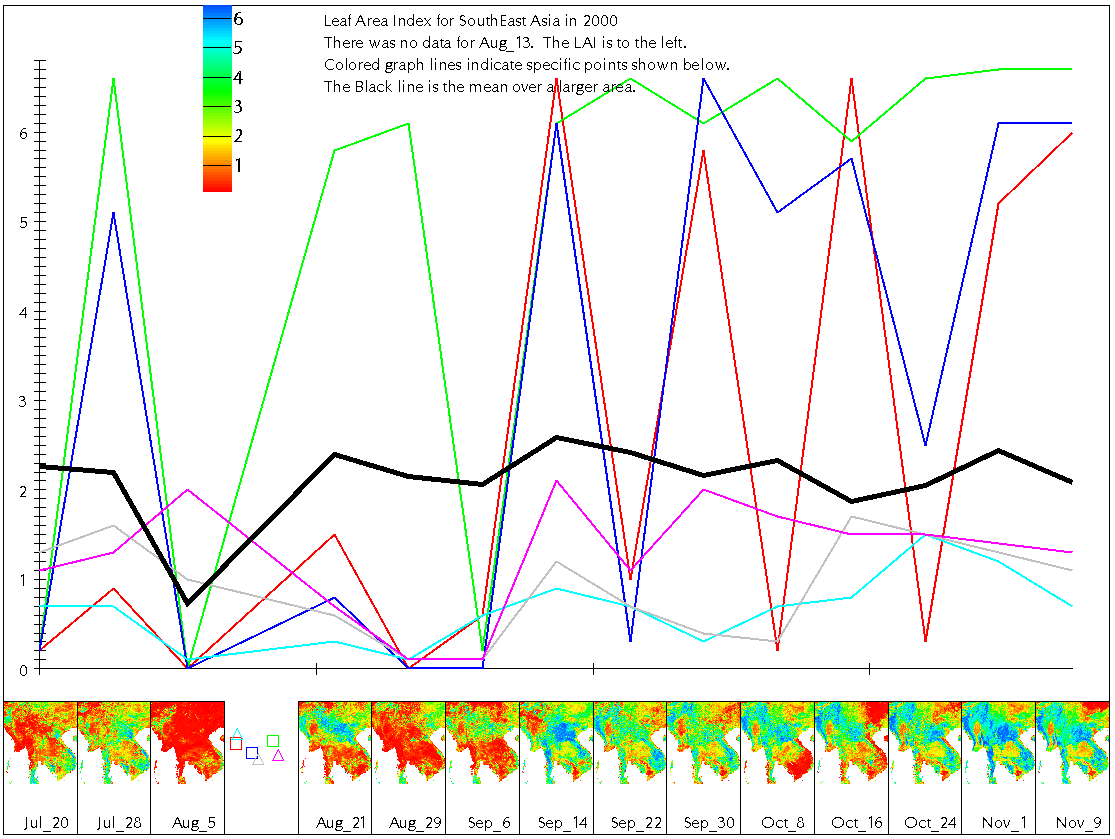
This image shows LAI for 14 8-day periods. Two leafy points and
and three low_LAI points were randomly selected for graphing along
the same time-scale as the thumbnail images. The black line shows
the spatial mean LAI over the full SE Asia area depicted on the
left side of the first maps on this page. When these data were aggregated
into months, August was a mean of Aug5, Aug21, and Aug29 and September
was a mean of Sept6, Sept14, and Sept22.
Here is postscript.
Questions:
Harvey Greenberg
Last updated : 10/28/2004 23:14:50


